preferred on


Key Takeaways
- Bitcoin trades at $73,464, 0.4% above its 200-day SMA, despite ETF outflows.
- US spot ETFs lost $299.8 million on Nov. 11, their fifth straight outflow session.
- Strategy’s 1,847 BTC covers 7.5% of ETF outflows since Nov. 2.
Bitcoin (BTC) traded at $73,464 on Binance on Nov. 12, 0.4% above its 200-day simple moving average (SMA) of $73,173.
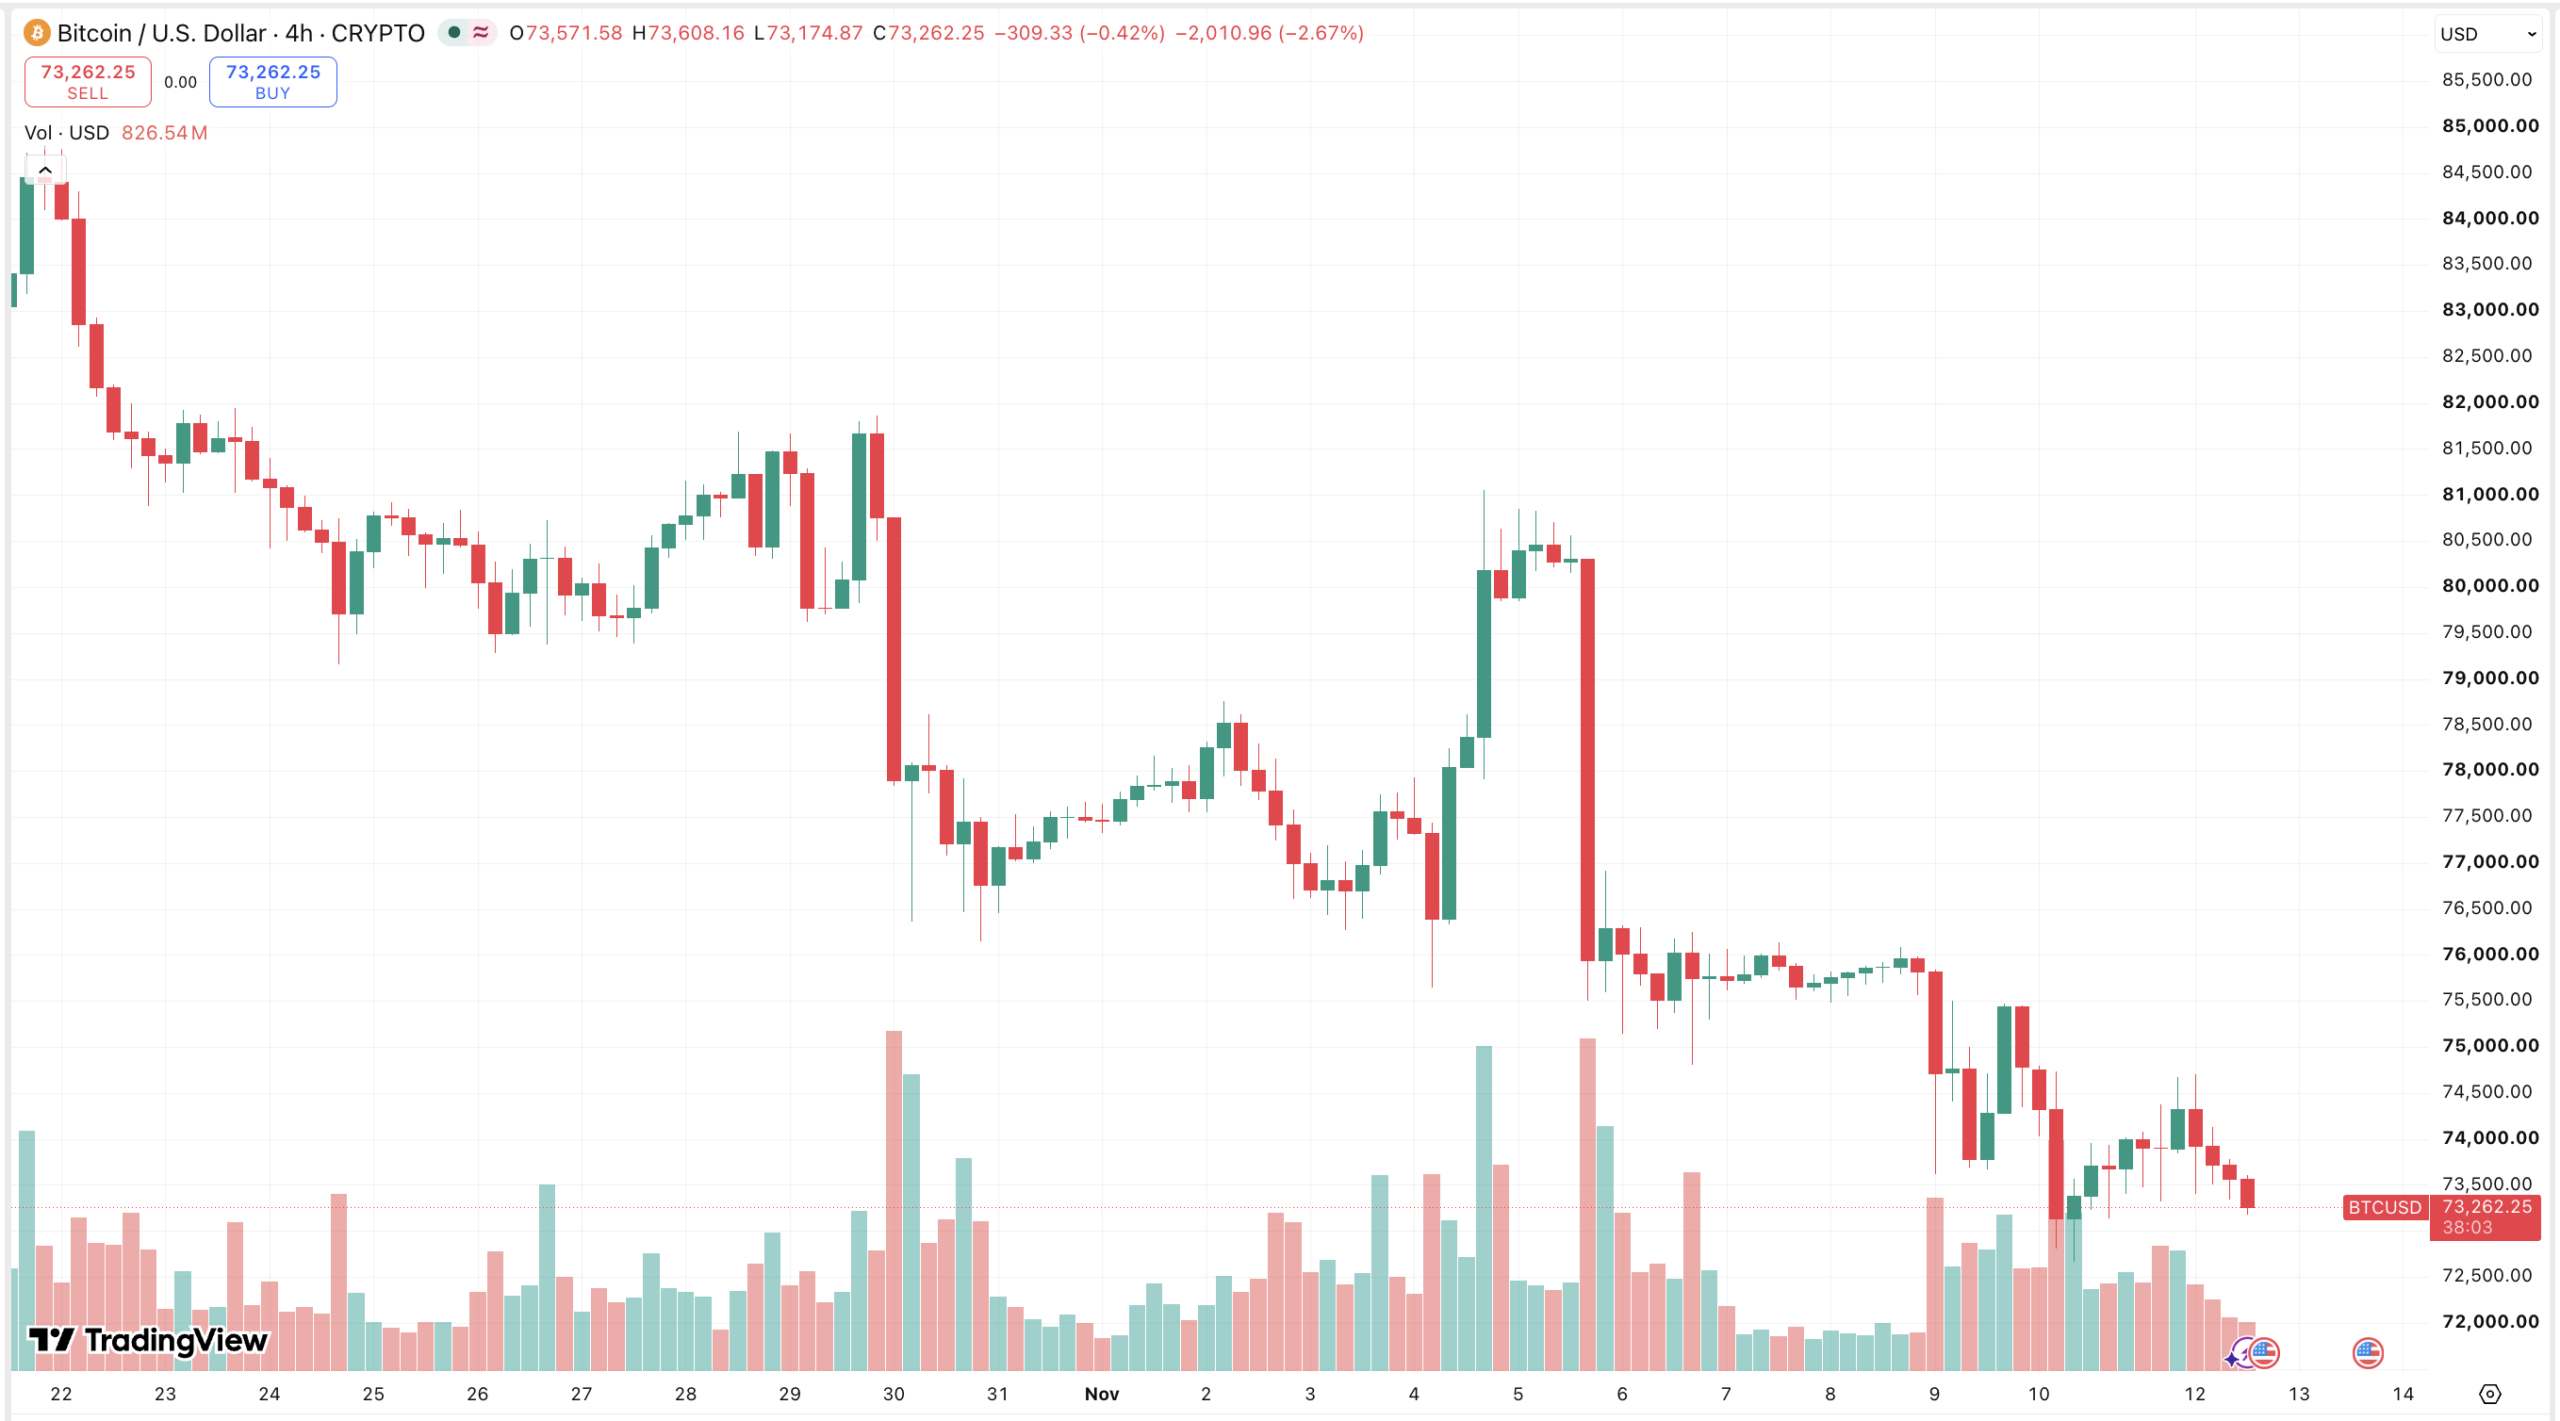
Farside recorded $299.8 million of US spot Bitcoin exchange-traded fund (ETF) outflows on Nov. 11, the fifth straight net outflow session, yet Binance’s daily candle closed at $74,015. Strategy bought only 1,847 BTC across Nov. 2 and 9, against about 24,700 BTC of ETF net outflows since Nov. 2.
Bitcoin ETF outflows reach $1.44 billion in five sessions
IBIT shed $269.7 million and GBTC $39.1 million, while MSBT took in $9 million, lifting the five-session total to $1.44 billion. Farside’s data shows $2.85 billion of net outflows over 15 sessions since Oct. 22, 4.9% of the $58.02 billion cumulative net inflow before that run.
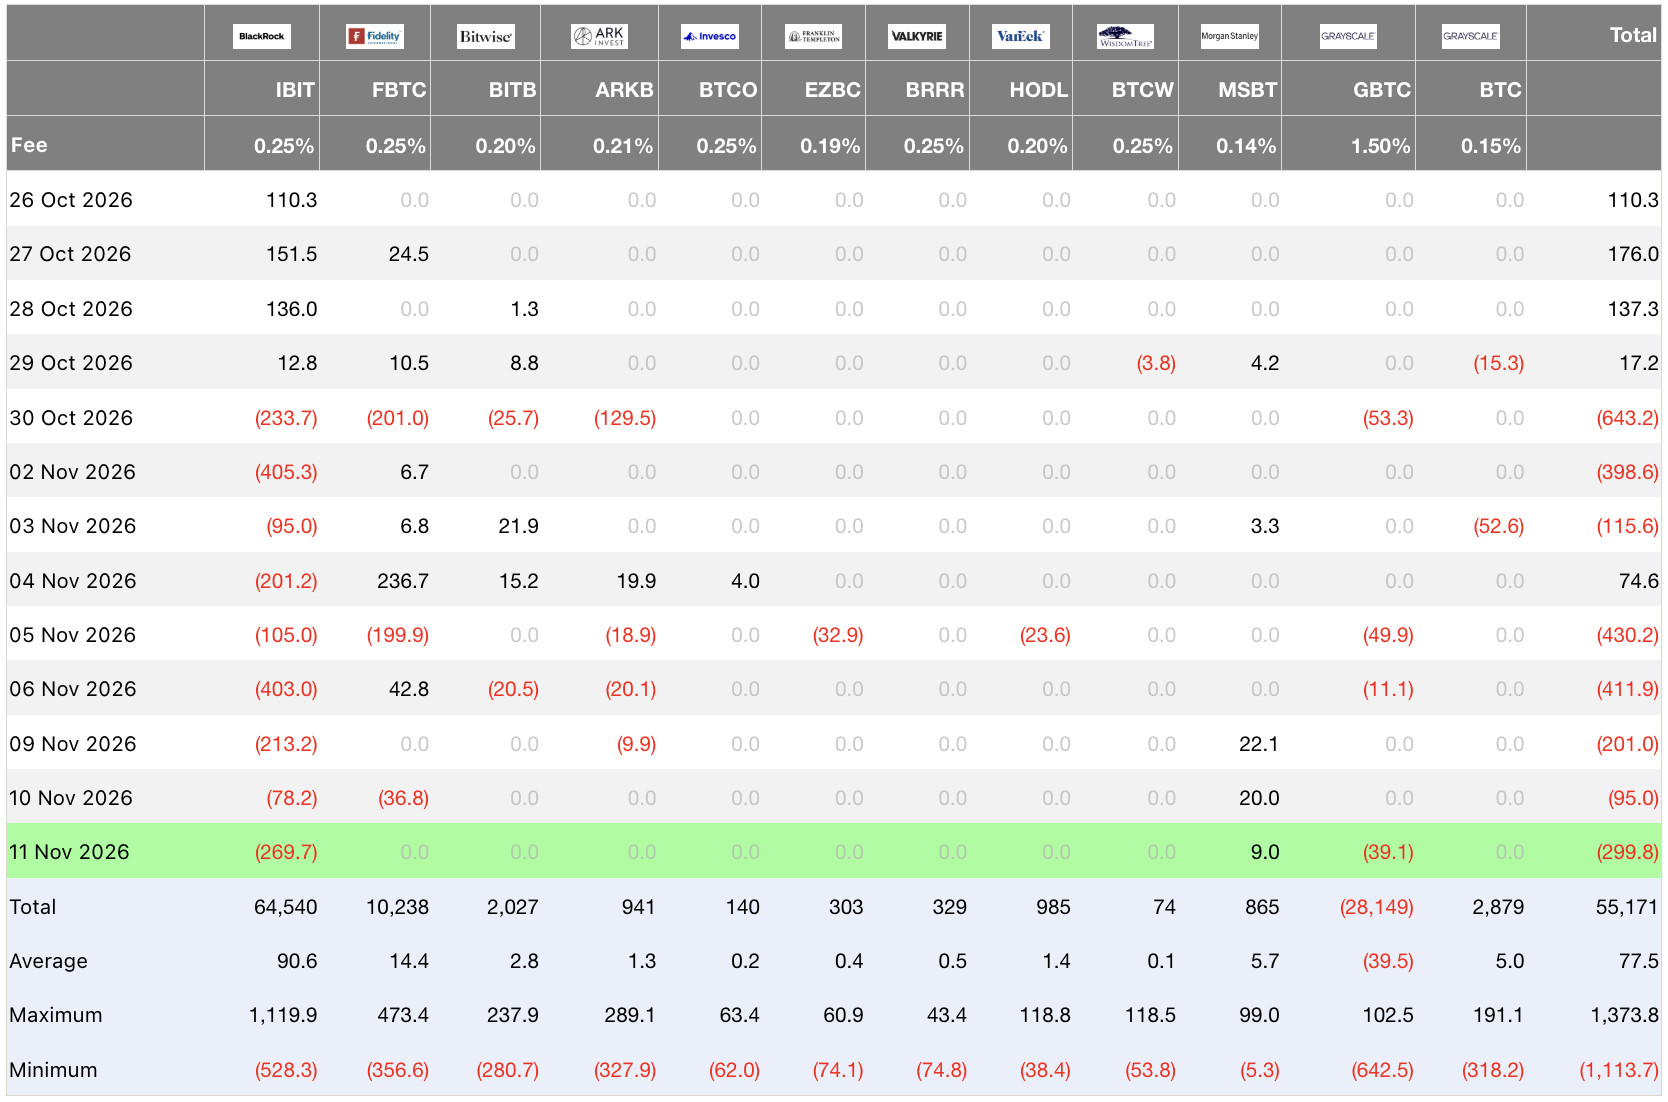
IBIT’s nine-session streak totals $2 billion, the third longest since launch behind 13 sessions in May and June and 11 in June and July. It extends the $1.28-billion ETF outflow week and the IBIT outflows that tested the 200-day SMA on Nov. 9.
Bitcoin exchange inflows and Strategy buying show a thin bid
The $942 million is the second largest two-day total of 194 windows since May 1, behind $950 million on June 1 and 2. It returns about half of the $1.84 billion that left exchanges on Oct. 29, the largest net outflow of the series, the day of the Binance hack that fed heavy withdrawals.
Strategy’s purchases equal 7.5% of the ETF outflow. Its Nov. 9 purchase of 1,036 BTC at $79,012 cost 7.0% more than the current price, so the one visible buyer is already underwater on its latest buy.
Bitcoin open interest and options show little leverage stress
Binance open interest stood at 99,023 BTC at 10:00 UTC, 2.2% below the 101,243 BTC peak on Nov. 10, and 74.1% of accounts are long. Open interest climbing into the dip also marked Nov. 3, but funding settled at 0.0062% at 08:00 UTC, below the 0.0100% baseline, so perpetuals trade at a slight discount.
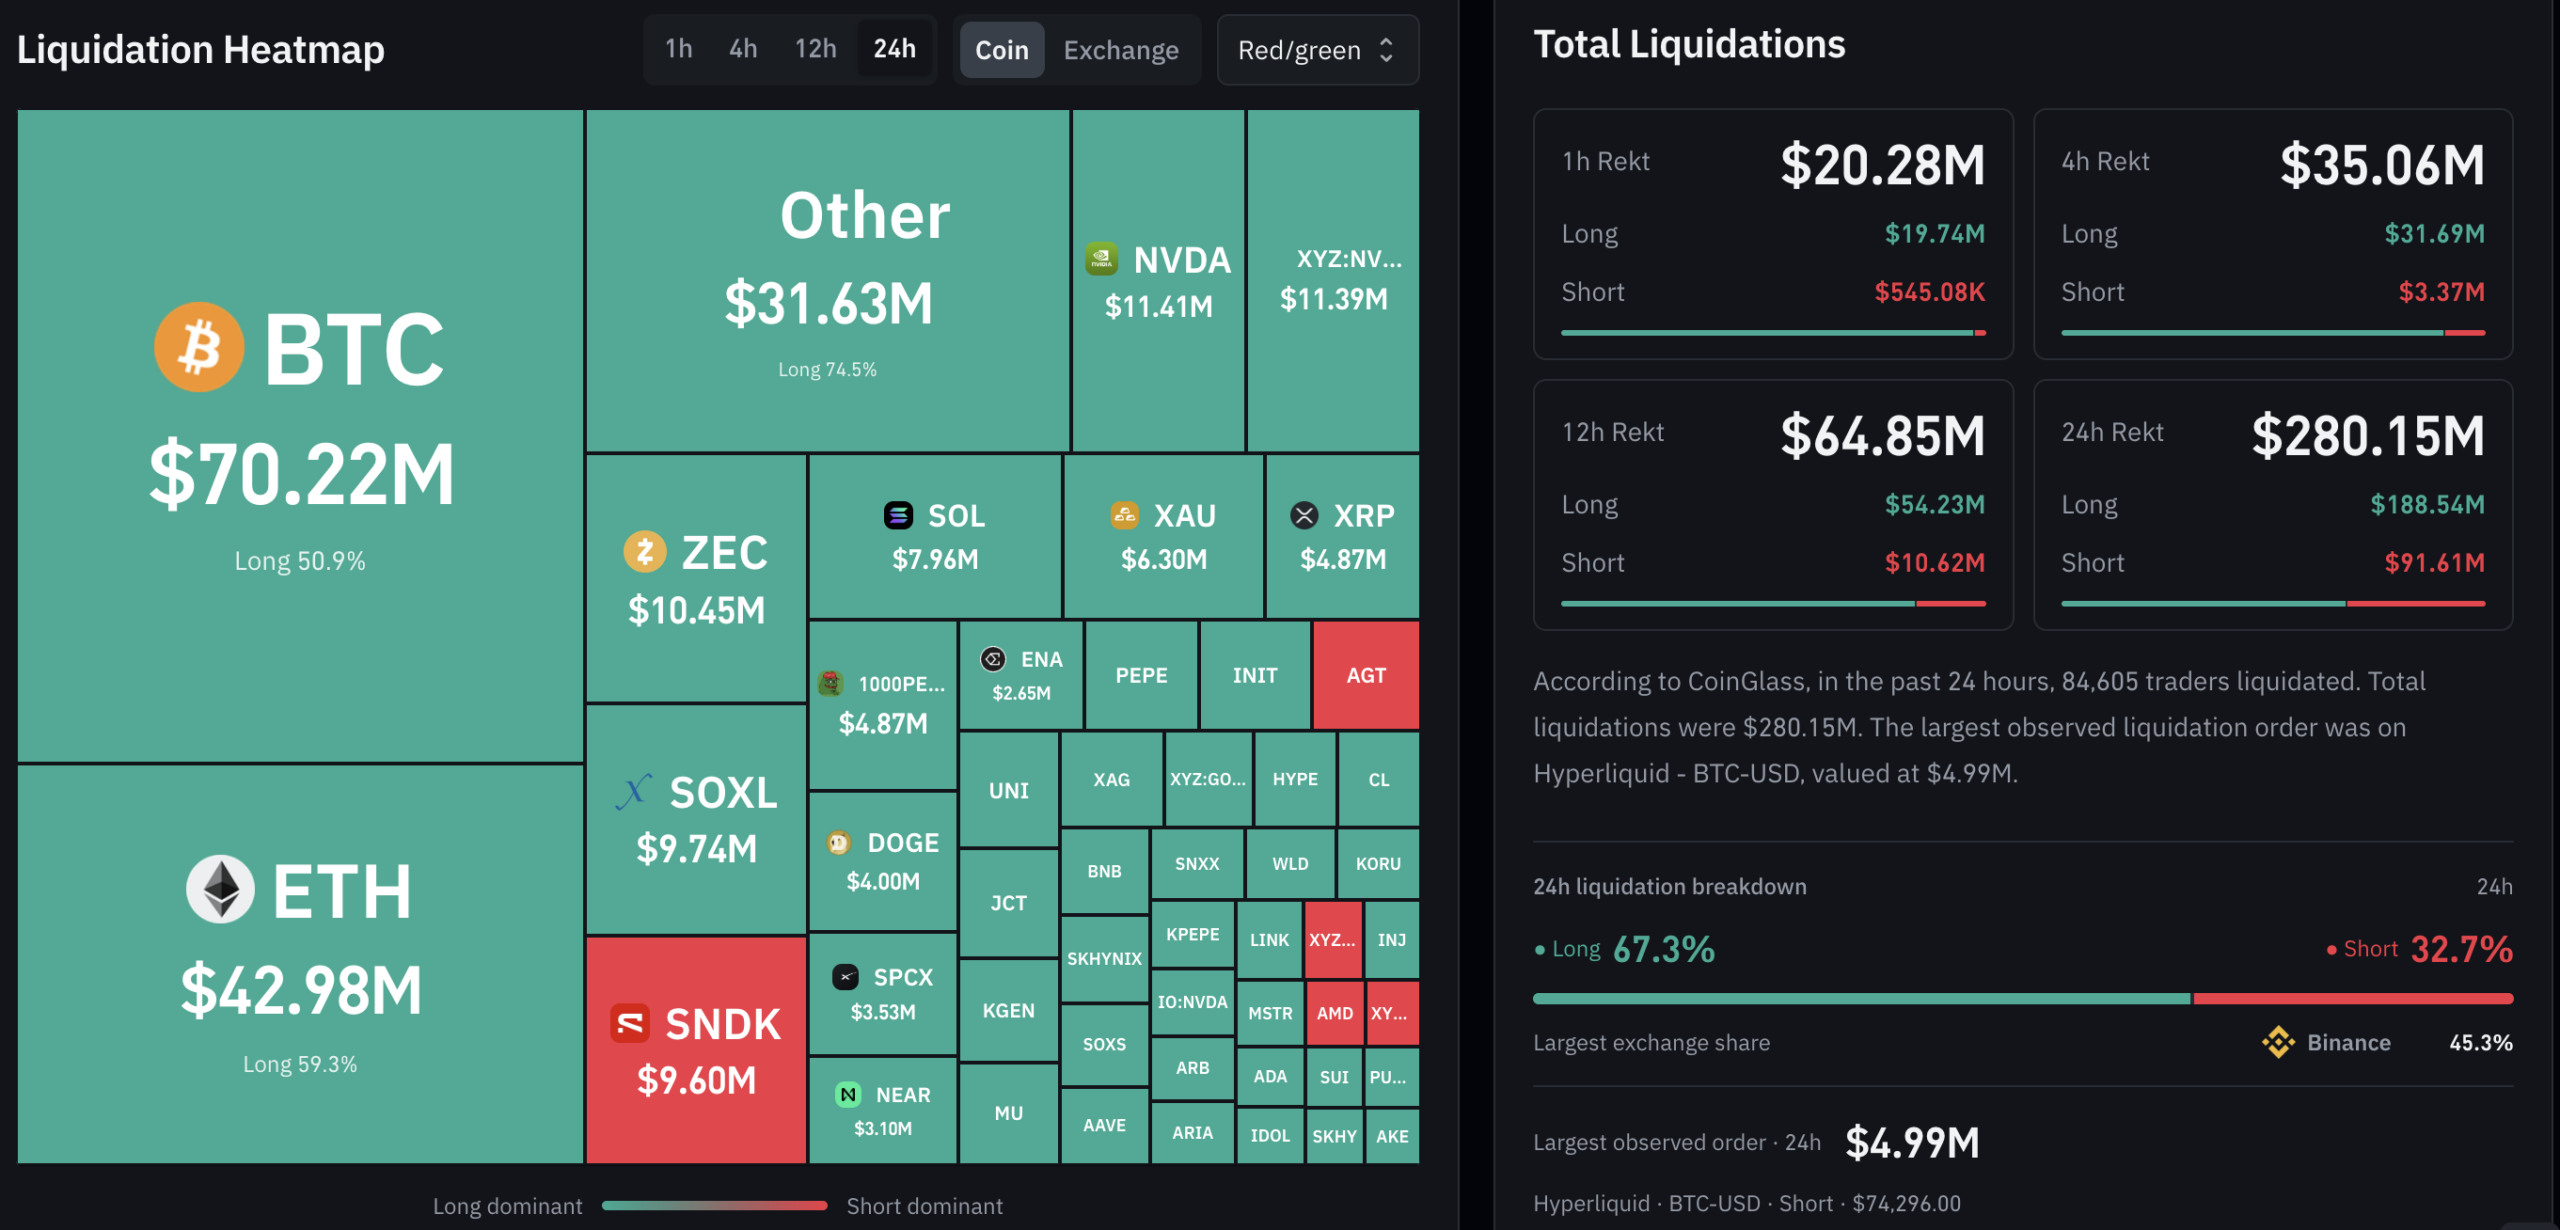
CoinGlass counted $62.9 million of liquidations in 24 hours, 54.7% shorts, and 69% below the $200.6 million counted in the 24 hours to 09:48 UTC on Nov. 11. Deribit’s Nov. 13 expiry holds 22,086 BTC of calls against 11,401 BTC of puts, about $2.46 billion of notional, with 61% of calls at $81,000 and $84,000 and max pain at $76,000.
Bitcoin price analysis: $73,092 support and $75,309 resistance
TradingView lists the daily candle at an open of $73,923, a high of $74,117, a low of $73,188, and a close of $73,382 as of 10:48 UTC.
Bitcoin sits below the 10-day exponential moving average (EMA) at $75,309, the 200-day EMA at $76,364, and the 50-day SMA at $80,903, and above the 200-day SMA at $73,092.
The relative strength index (RSI) reads 34, the moving average convergence/divergence (MACD) level of -1,953 gives a downward signal, and the average directional index (ADX) at 22 shows no strong trend. Twelve of 15 moving averages carry downward signals.
A Bitstamp daily close below $73,092 would extend the decline toward Binance’s Aug. 19 close of $69,335 and the 200-week SMA, which averages $67,760. A close above the 10-day EMA would put the 200-day EMA, the level behind the Nov. 4 wick, back in play.
The Bureau of Labor Statistics releases the October Producer Price Index at 8:30 am ET on Nov. 13, 5.5 hours after the 08:00 UTC options expiry, and $73,092 is the line to hold.
Disclaimer: This article is for informational purposes only and does not constitute financial or investment advice. Cryptocurrency prices are highly volatile. Always conduct your own research before making investment decisions.