preferred on


Key Takeaways
- Solana DEX volume fell 12.6% in two days as Binance SOLUSDT volume fell 41%.
- The Nov. 13 to 15 sell-off lifted Binance volume 122.8% and DEX volume 14.5%.
- SOL ETFs took in $11.7 million on Nov. 16, ending nine outflow sessions.
Solana (SOL) traded at $73.74 on Binance at 12:46 UTC on Nov. 17, 17% under its 200-day simple moving average (SMA) of $88.79.
DefiLlama shows Solana decentralized exchange (DEX) volume at $1.48 billion on Nov. 16, down 12.6% from $1.69 billion on Nov. 14, while Binance’s SOLUSDT spot volume fell 41% over the same two sessions, to $202 million from $343 million.
The three sell-off sessions from Nov. 13 to 15 lifted Binance volume 122.8% above its Nov. 6-12 average and decentralized exchange (DEX) volume only 14.5%, so the crash was traded mostly on Binance. SOL has recovered 9.4% from the $67.41 low of Nov. 15.
Solana DEX volume holds while Binance volume fades
DEX volume ran $1.34 billion a day from Nov. 6 to 12 and $1.54 billion a day through the sell-off, while Binance’s SOLUSDT volume went to $324 million from $145.5 million.
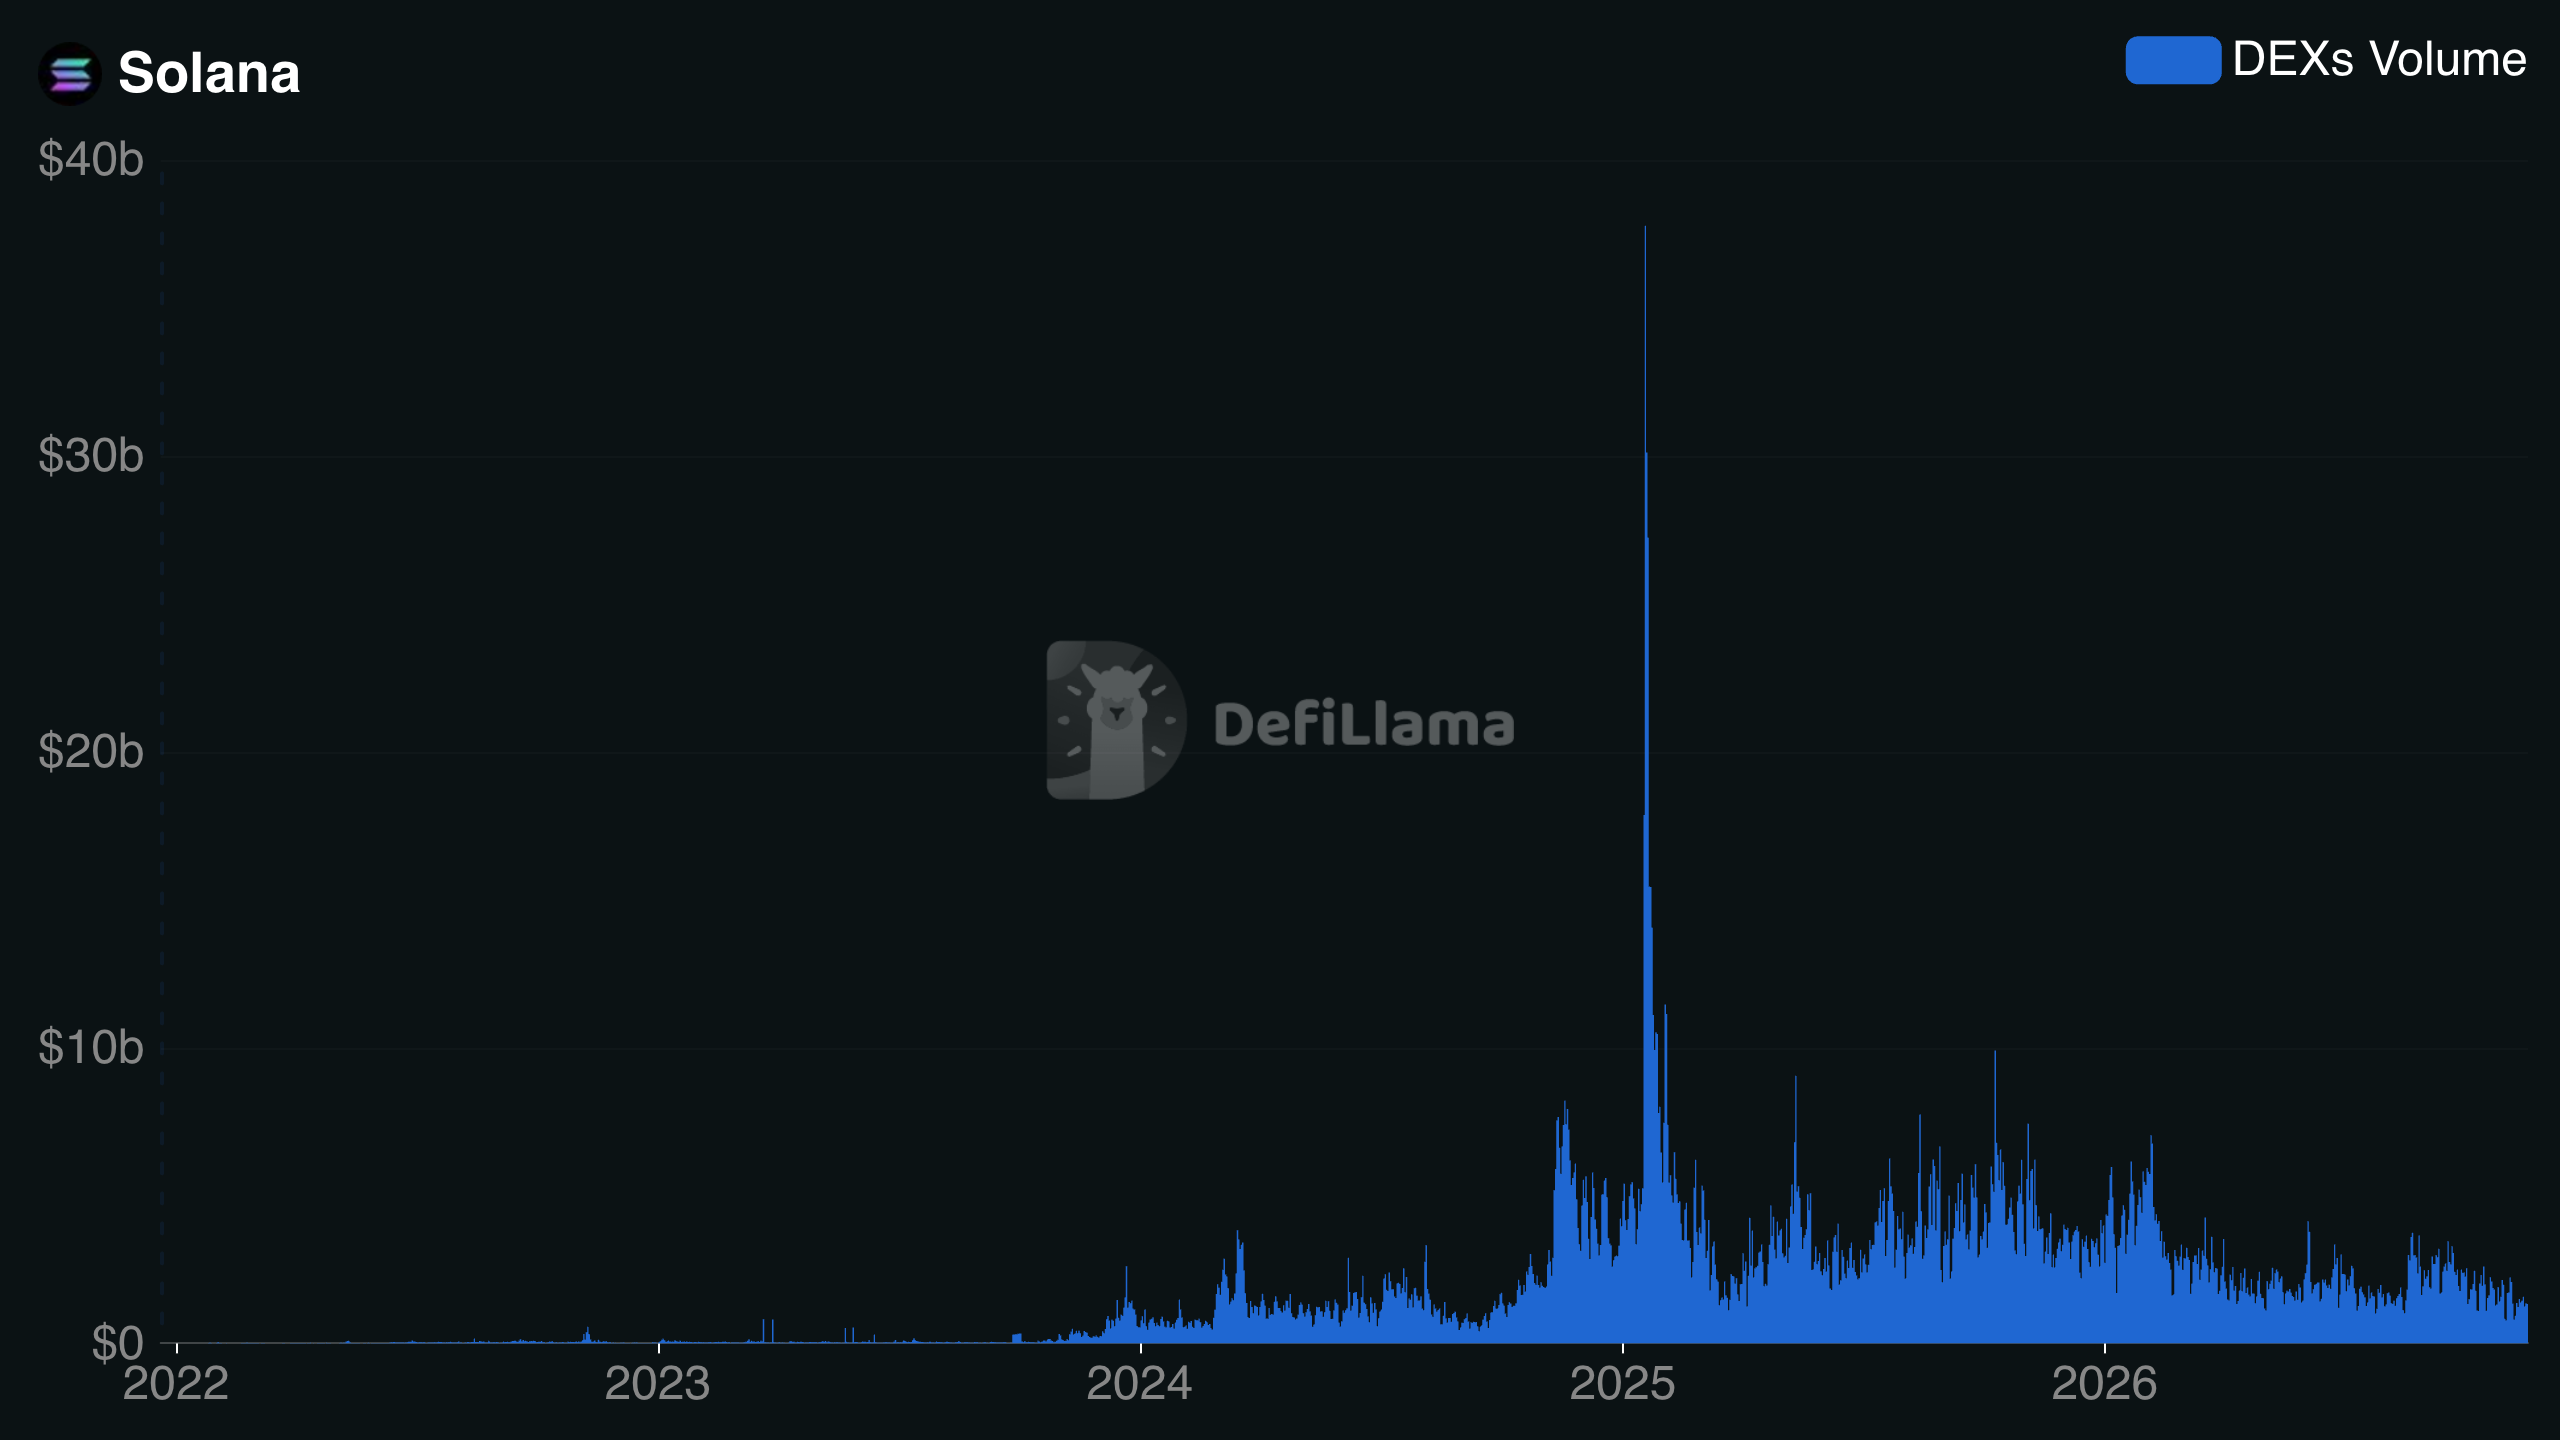
Nov. 16 closed 10.3% above the DEX average and 38.9% above Binance’s. DEX volume was 10.2 times Binance SOLUSDT volume on Nov. 12 and 4.9 times on Nov. 14, and the ratio recovered to 7.3 times on Nov. 16, so the sell-off pulled activity toward Binance, and part of it has returned.
Onchain volume was already shrinking before the crash since seven-day DEX volume had dropped 19.68% by Oct. 8 and 21.4% by Oct. 12, while Solana-based perpetual volume rose 115% in the week to Oct. 7. Binance covers one pair, and DEX volume covers every token on Solana, so only the changes compare.
Solana price analysis: $77.05 resistance and $67.41 support
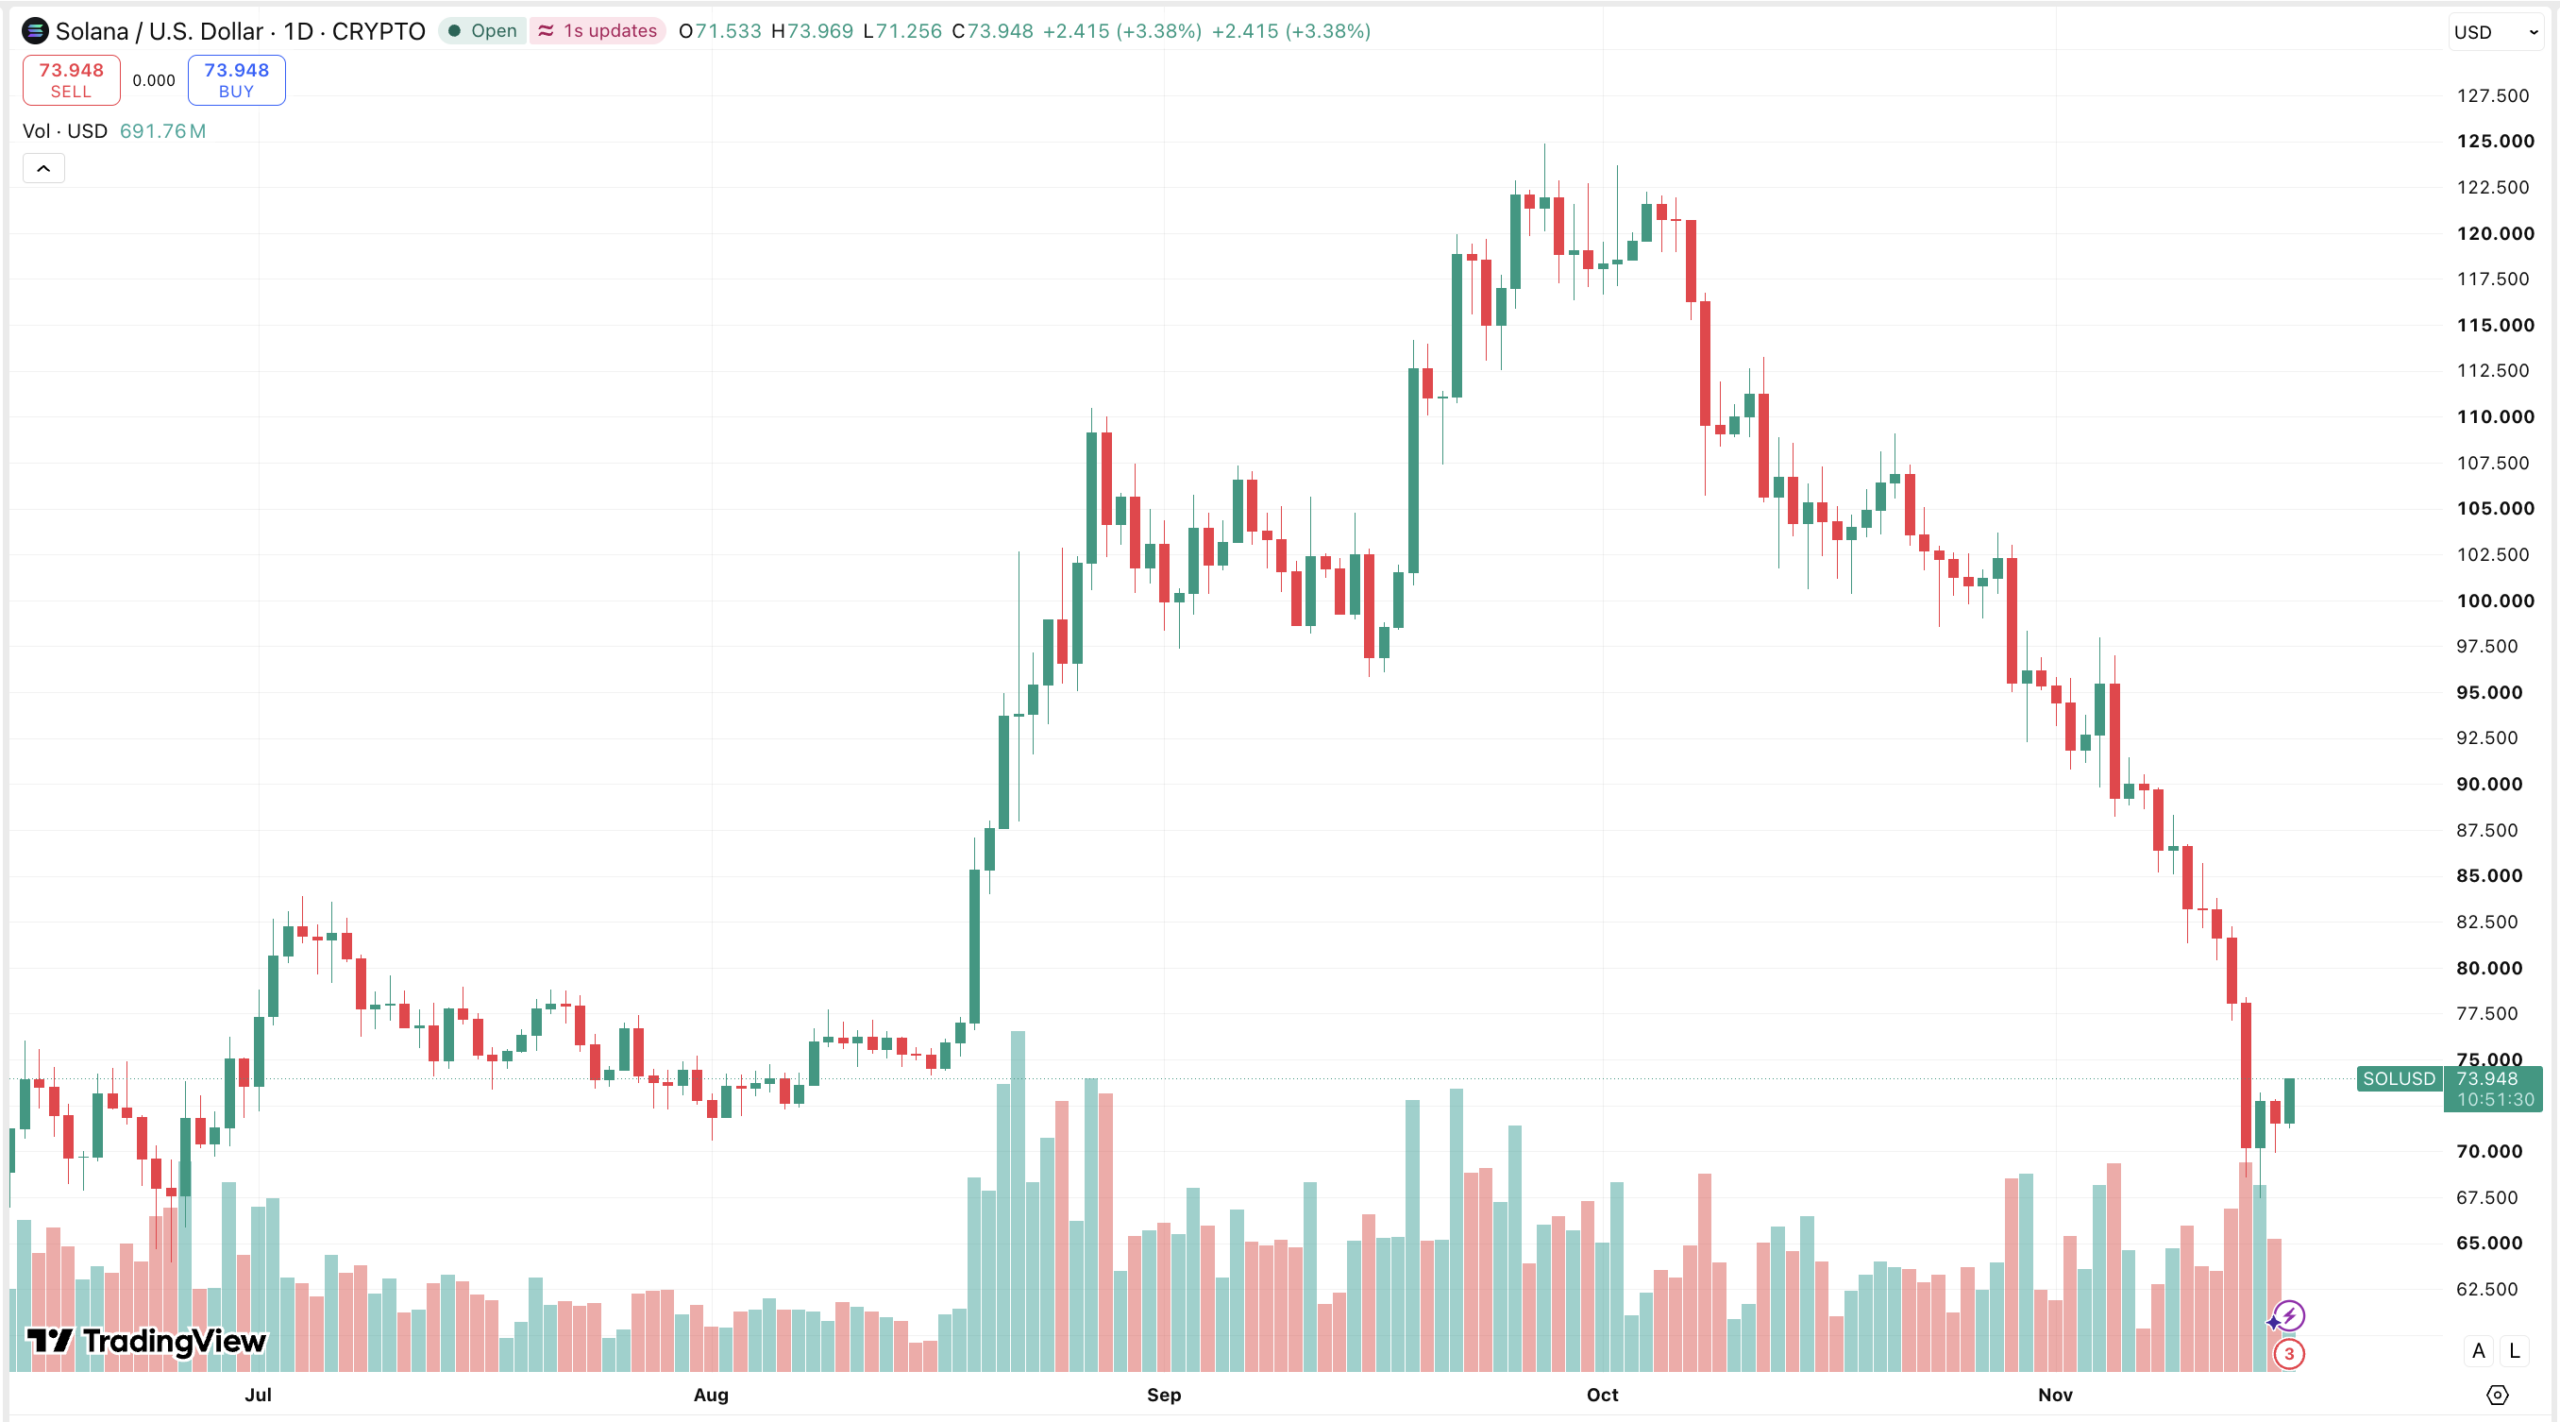
TradingView lists the daily candle at an open of $71.526, a high of $73.818, a low of $71.245, and a last price of $73.715 as of 12:43 UTC.
The price sits below the 10-day exponential moving average (EMA) at $78.25, the 20-day EMA at $84.54, the 200-day SMA at $88.67, and the 200-day EMA at $95.95, and 13 of 15 moving averages carry downward signals. Only the Hull moving average at $69.26 gives an upward signal.
The relative strength index (RSI) of 26.3 is oversold, but the moving average convergence/divergence (MACD) level of -7.71 signals downward momentum, and the average directional index (ADX) of 47.9 shows a strong trend.
Resistance is the $77.05 Aug. 18 Binance close, which the Nov. 13 analysis flagged as support, 4.5% above price, then the 10-day EMA 6.1% above. A daily close above $77.05 would signal upward momentum. Support is the Nov. 15 Binance low of $67.41, and a daily close under it points to the $62.20 June 6 daily close, a downward signal.
Solana ETF flows and open interest after the sell-off
SoSoValue reports US spot SOL exchange-traded funds (ETFs) took in $11.7 million on Nov. 16, led by BSOL at $10.8 million, ending nine outflow sessions that drained $95.5 million from Oct. 29 to Nov. 13. The streak ran through the ETF outflows that tested the 200-day SMA on Nov. 6.
Binance open interest stands at 8.71 million SOL ($640 million), 11.5% under its Nov. 10 peak, set during the 200-day SMA loss and open interest rebuild. Funding printed negative 0.0126% at 08:00 UTC, while 76.1% of accounts are long, so shorts pay a crowd that still leans long.
Disclaimer: This article is for informational purposes only and does not constitute financial or investment advice. Cryptocurrency prices are highly volatile. Always conduct your own research before making investment decisions.