preferred on


Key Takeaways
- Bitcoin’s weekly close fell under the 200-week SMA for the first time since Aug. 10.
- Binance open interest fell 8% from its Nov. 12 peak, while Bitcoin fell 10%.
- Only 46% of the drop in dollar open interest came from closed positions.
Bitcoin (BTC) traded at $64,568 on Binance at 10:59 UTC on Nov. 16, 11.5% under its 200-day simple moving average (SMA) of $72,920.
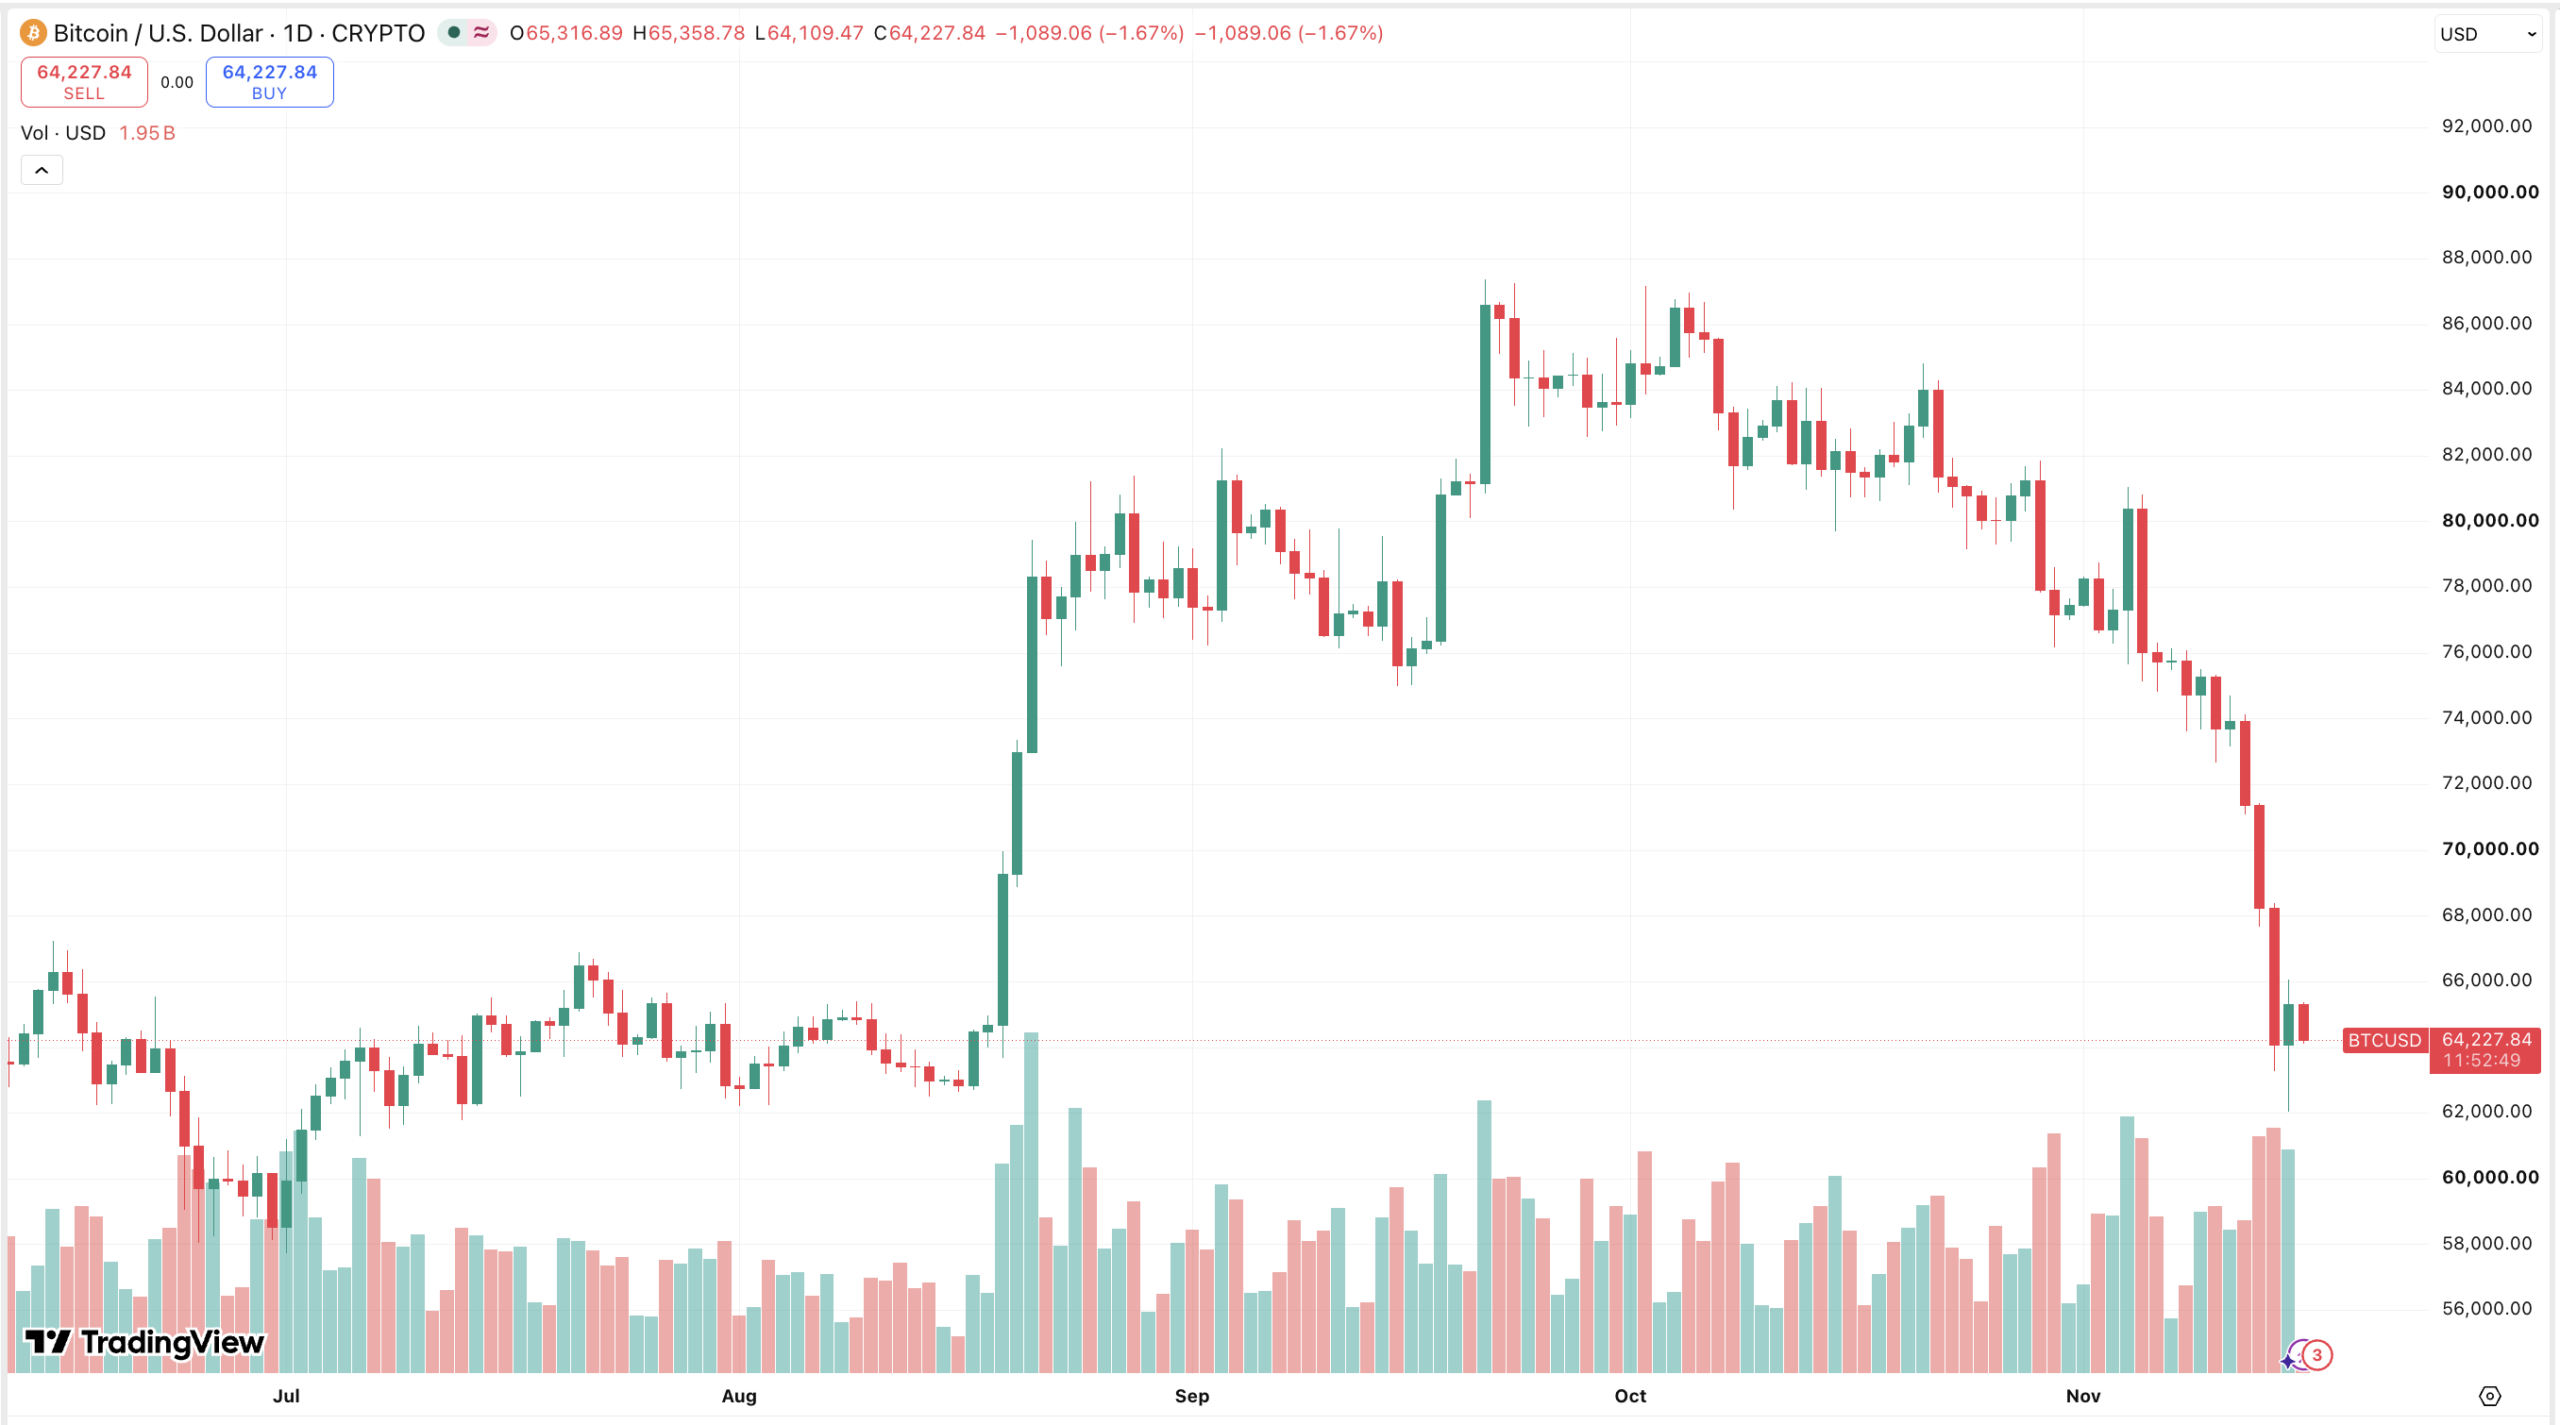
Binance’s weekly candle closed at $65,351 on Nov. 15, 3.9% below the 200-week SMA of $67,983, marking the first weekly close below it since the Aug. 10 week.
Binance open interest stands at 93,994 BTC, 8% under its 102,149-BTC peak at 16:00 UTC on Nov. 12, while the hourly close fell 10% from $71,755 to $64,575 over the same stretch.
Closed positions explain only 46% of the $1.28 billion fall in dollar open interest, so repricing did most of the work and leverage remains heavy.
Bitcoin open interest rose before it fell
Binance open interest climbed 5.7% to 96,626 BTC at 00:00 UTC on Nov. 12, while BTC slid 3.2%, so traders added leverage into the first leg lower. The 200-week SMA wick followed on Nov. 13, with $872.5 million in long liquidations, and Binance open interest also climbed 4.7% into the Nov. 3 dip.
Funding peaked at 0.0100% on Nov. 13, turned negative at 16:00 UTC on Nov. 15 and 00:00 UTC on Nov. 16, so shorts paid longs, and was 0.0007% at 08:00 UTC. Still, 73.7% of Binance accounts are long, and open interest sits only 2.7% under its level at 00:00 UTC on Nov. 12, although BTC has fallen 12.8% since.
Bitcoin’s price loses the 200-week SMA for a third time in 2026
The Aug. 10 week ended at $62,900, 1.7% below $63,999, and the next weekly close was $77,734, 23.6% higher; the June 22 week ended at $59,577, 4.6% below $62,443, and also reversed within a week.
Two cases don’t form a pattern, and the live 200-week SMA of $68,192 is 5.6% above the current price.
Stablecoin supply and ETF outflows weigh on Bitcoin’s price
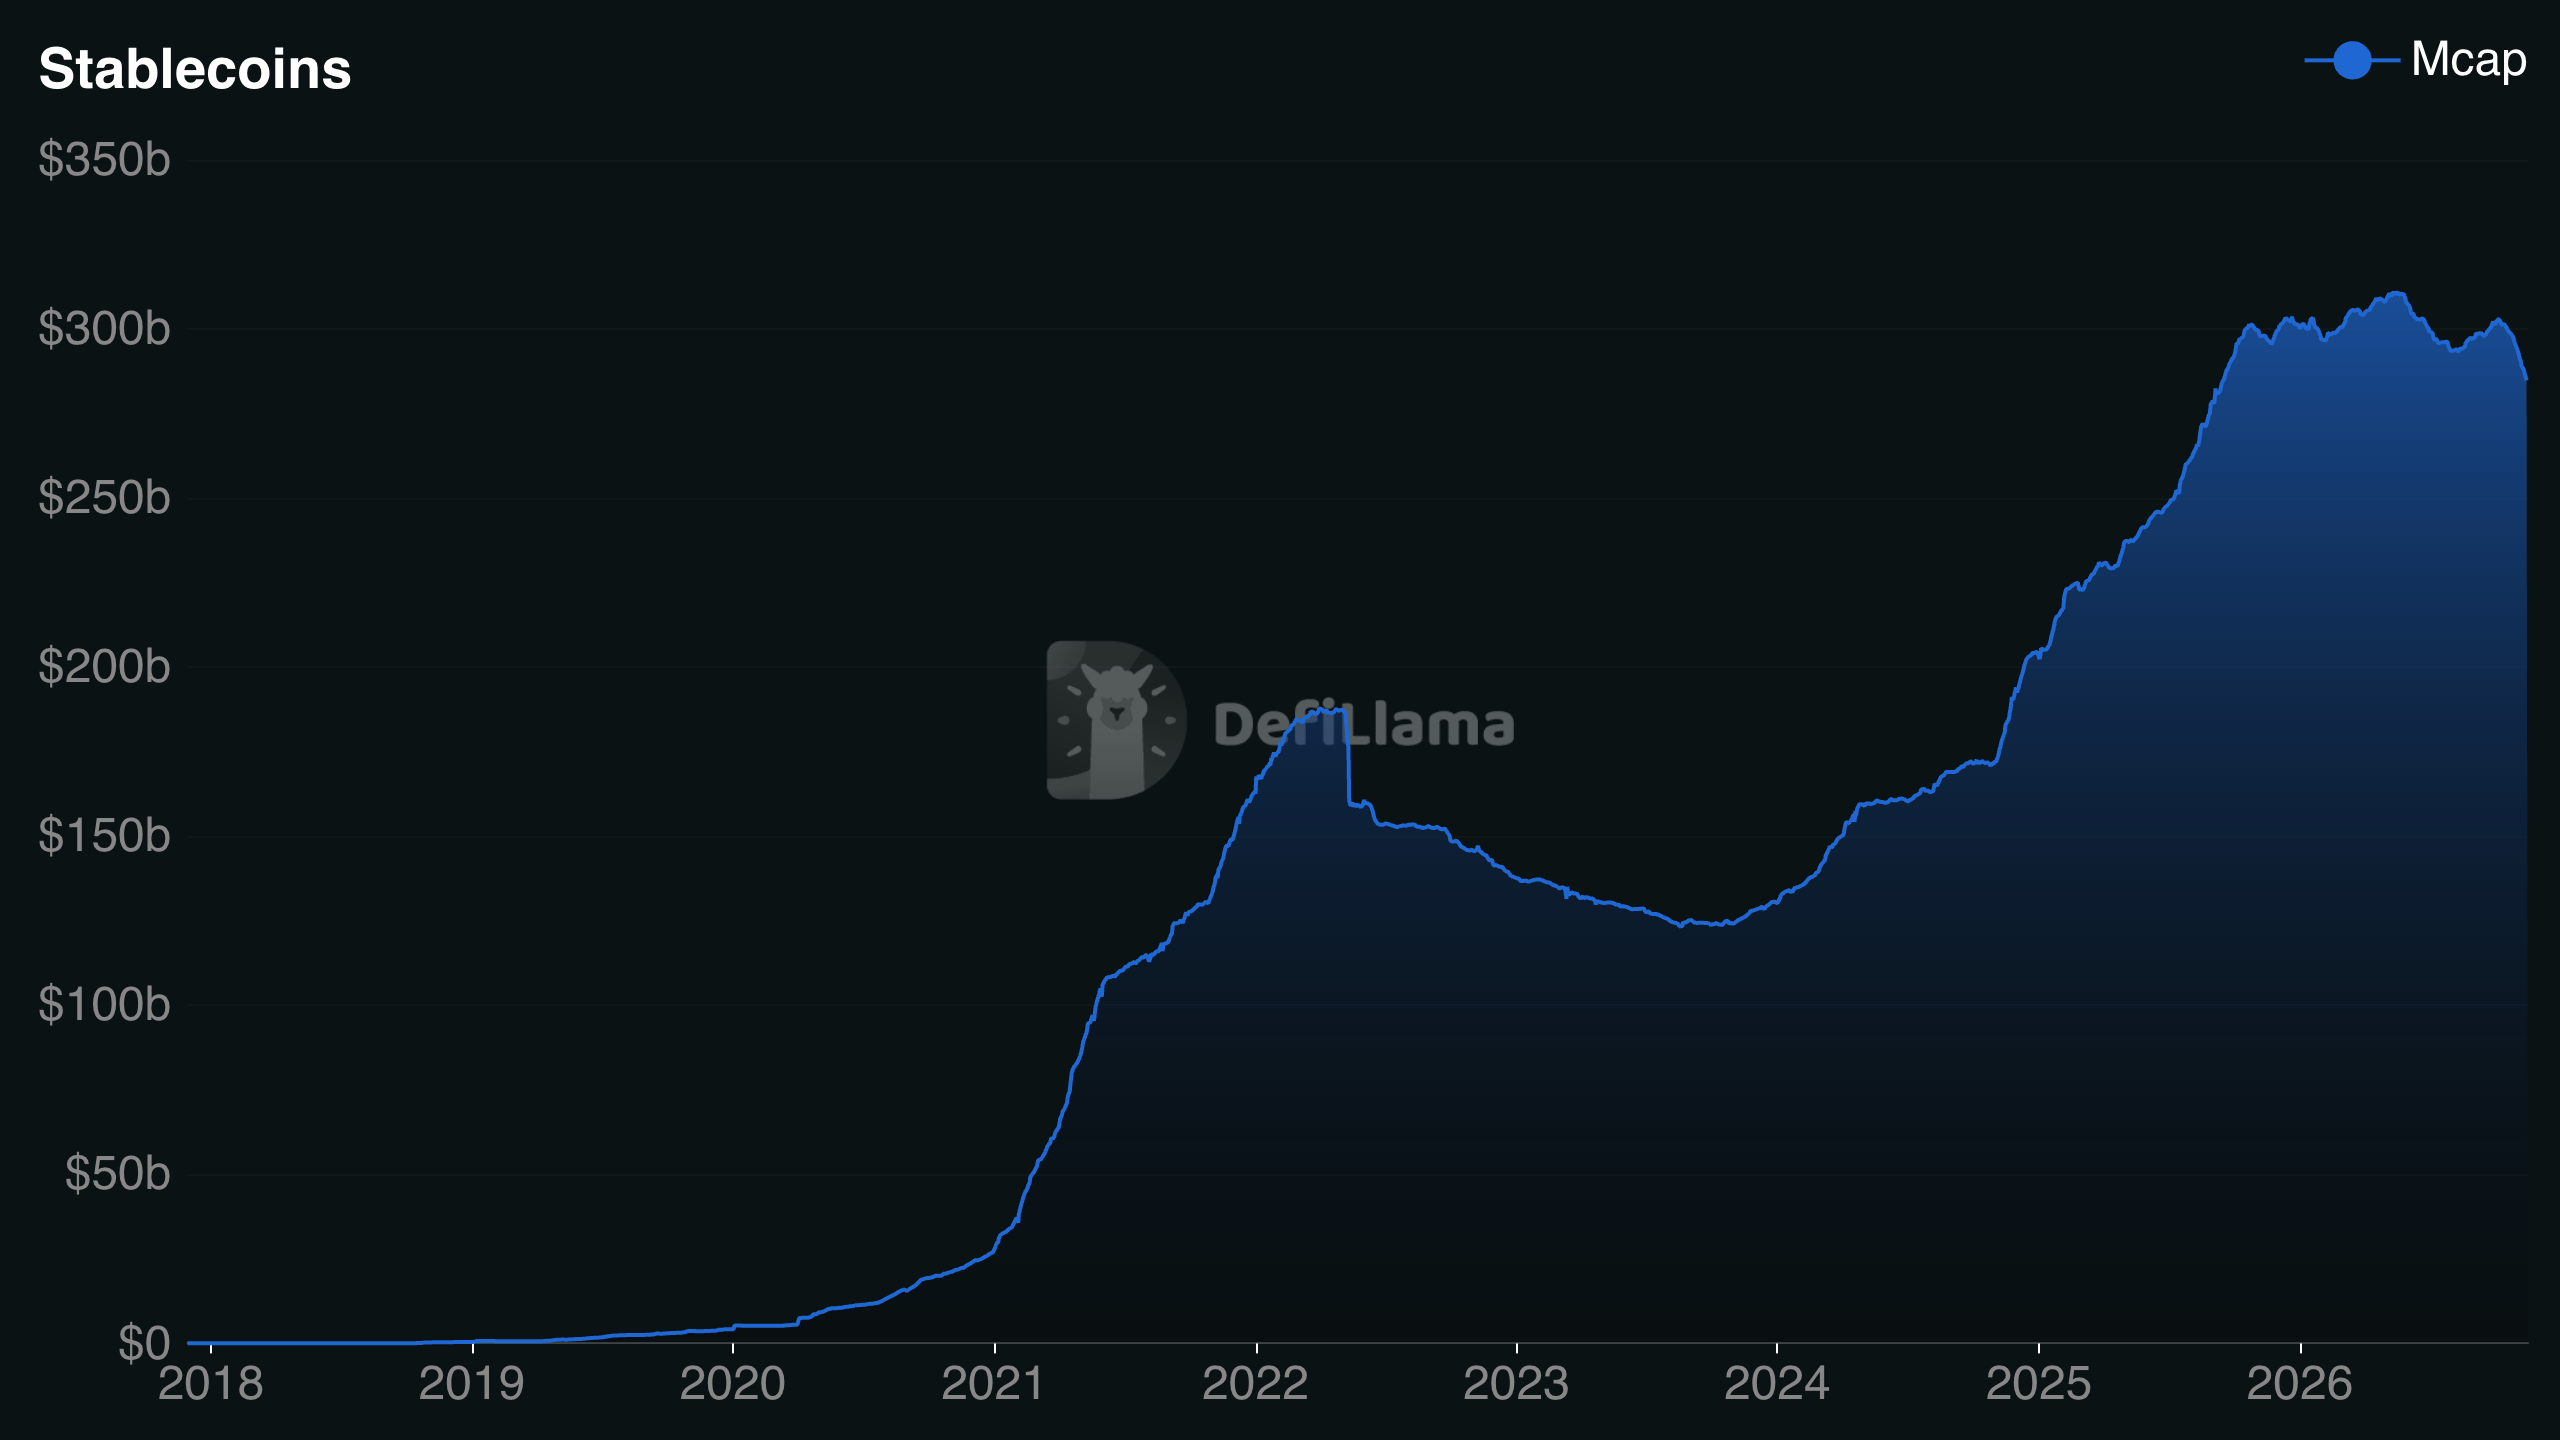
DefiLlama’s data shows stablecoin supply at $287.09 billion, down $15.63 billion, or 5.2%, since Oct. 17 and flat since Nov. 14. It extends the $14.2-billion stablecoin contraction Glassnode counted through Nov. 9 and 2.9 of the 5.2 percentage points left by Nov. 4, nine days before BTC first traded under the 200-week SMA.
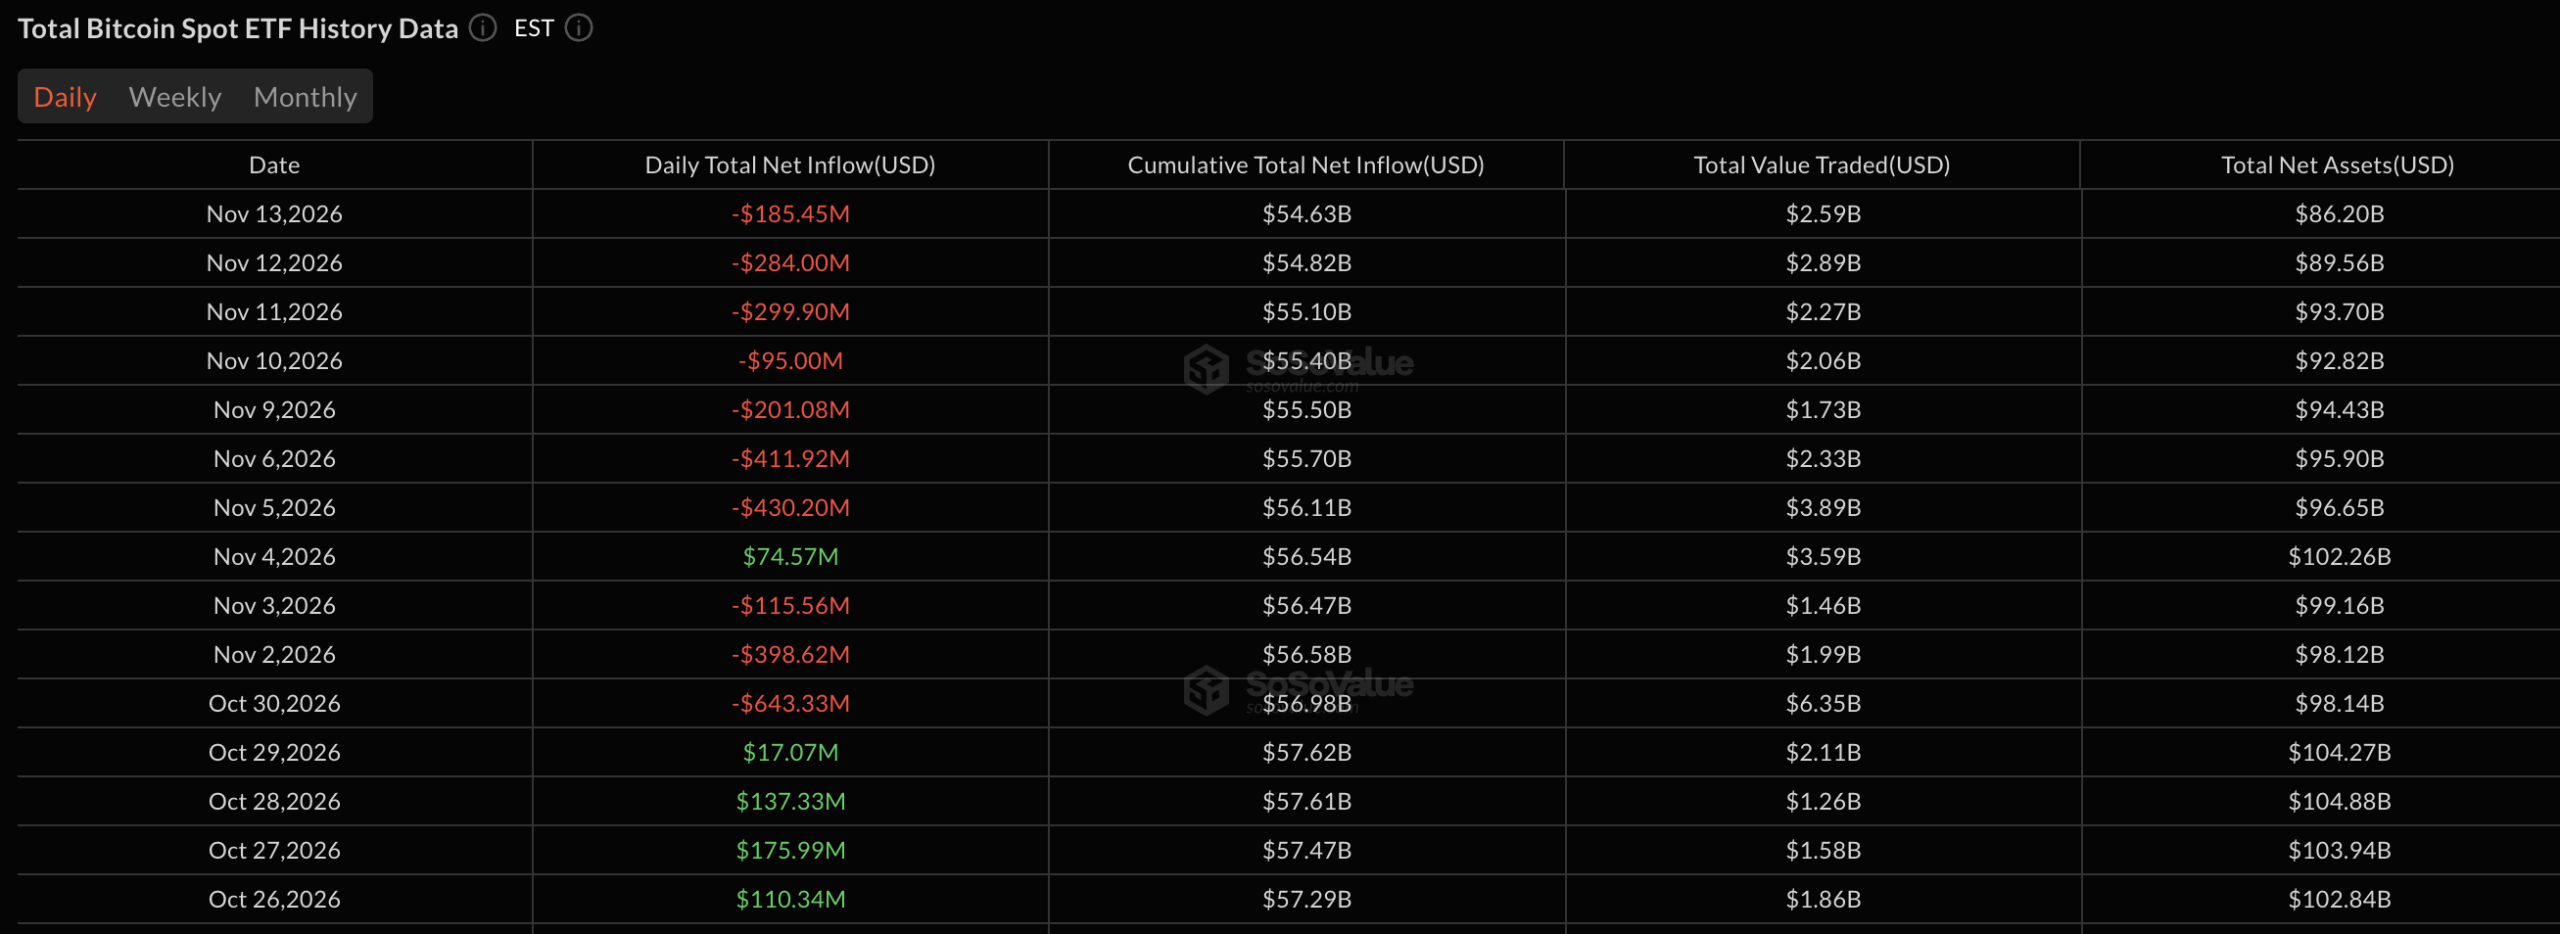
SoSoValue logs net US spot exchange-traded fund (ETF) outflows of $2.99 billion over the 11 sessions from Oct. 30 to Nov. 13, including the ETF outflow week of Nov. 2, with IBIT outflows accounting for $2.35 billion of the total.
Bitcoin price analysis: $62,006 support and $68,192 resistance
TradingView lists the daily candle at an open of $65,310, a high of $65,355, a low of $64,070, and a close of $64,538 as of 10:41 UTC.
Price sits under the 10-day exponential moving average (EMA) at $69,624, the 200-day SMA at $72,864, the 20-day EMA at $73,018, the 200-day EMA at $75,919, the level behind the Nov. 4 wick, and the 50-day SMA at $79,358, and 13 of 15 moving averages carry downward signals.
Binance puts its 200-day SMA at $72,920, and only the Hull moving average at $62,797 gives an upward signal.
The relative strength index (RSI) of 24 marks an oversold reading, yet the moving average convergence/divergence (MACD) level of negative 3,813 signals downward momentum, and the average directional index (ADX) of 34 shows a firm trend.
Support is the Nov. 15 Binance low of $62,006, 1.3% under the Hull moving average, and a daily close under it points to the $59,577 weekly close of June 22, a downward signal.
Resistance starts at the 200-week SMA of $68,192 and the 10-day EMA; a weekly close above $68,192 would signal upward momentum.
Deribit’s Nov. 27 expiry holds 4,128 BTC of open interest at the $63,000 put strike, 2.4% under the $64,532 index, against 4,819 BTC at the $90,000 call.
Disclaimer: This article is for informational purposes only and does not constitute financial or investment advice. Cryptocurrency prices are highly volatile. Always conduct your own research before making investment decisions.