preferred on


Key Takeaways
- Spot Bitcoin ETFs took in $7.9 million on Nov. 16, ending seven straight outflow sessions.
- Bitcoin was higher seven days after five of seven earlier outflow streaks ended.
- Calls at $73,000 or higher hold 51% of Nov. 20 expiry open interest.
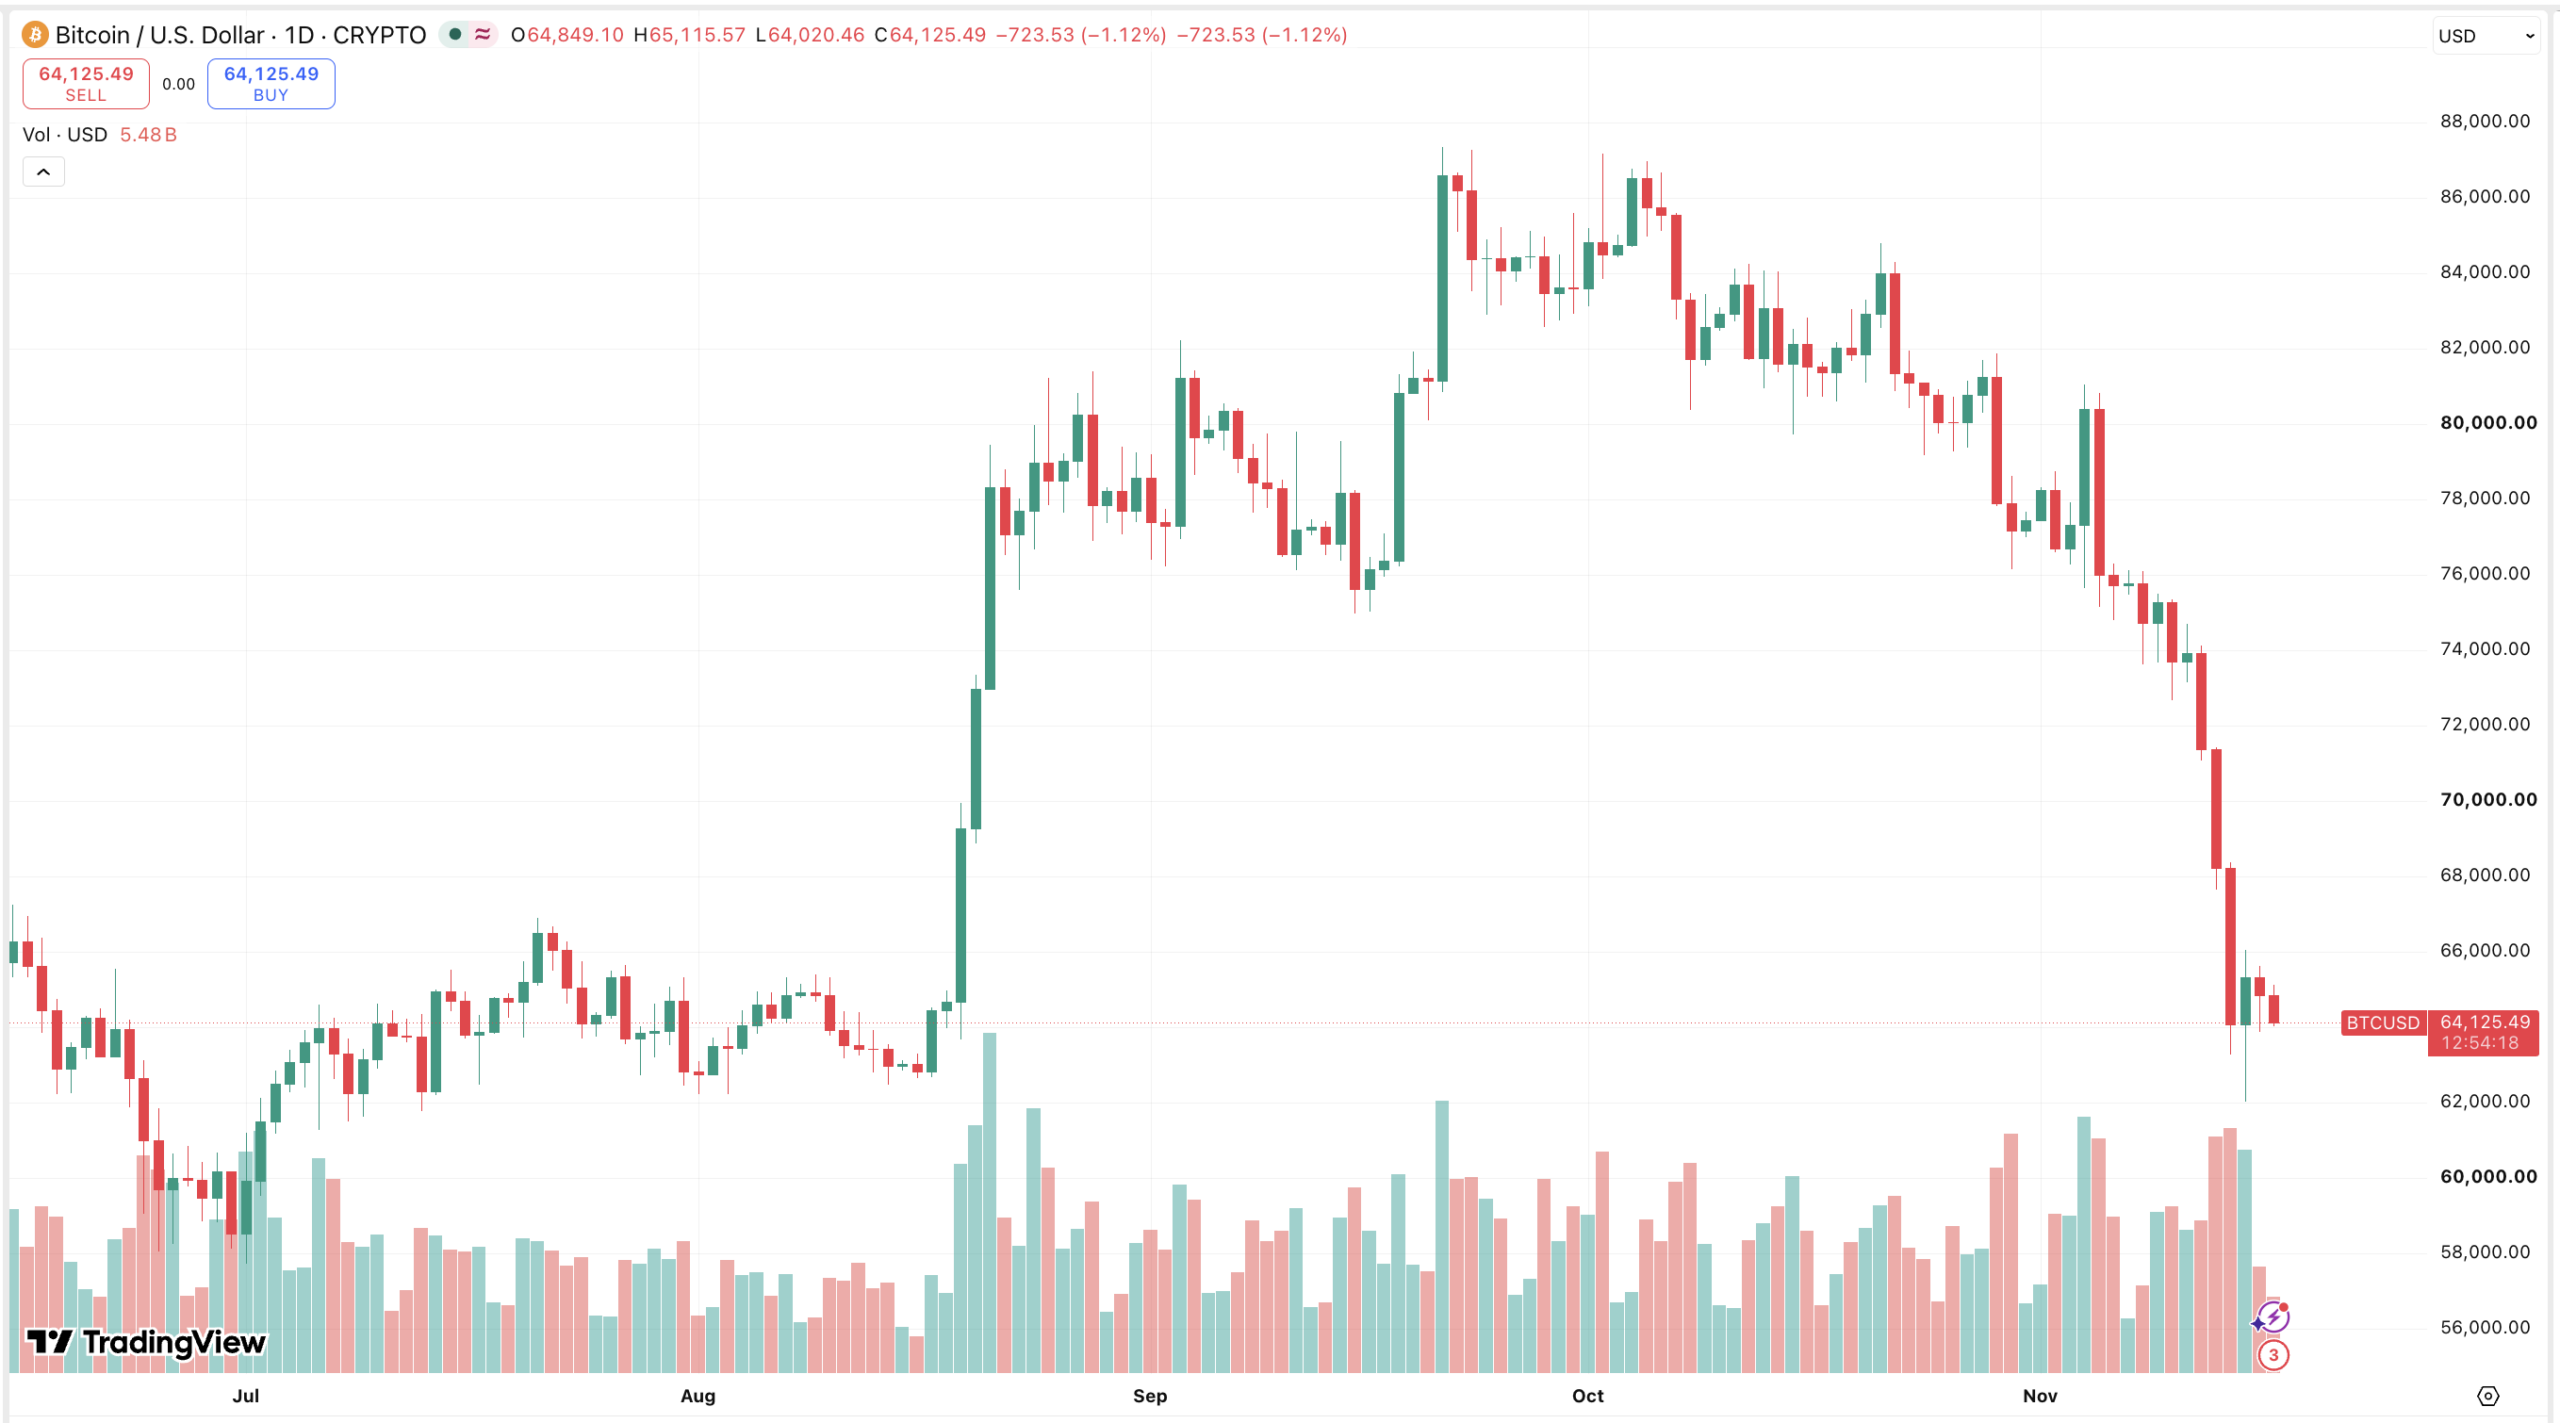
Bitcoin (BTC) traded at $64,229 on Binance at 10:51 UTC on Nov. 17, 11.8% under its 200-day simple moving average (SMA) of $72,851.
SoSoValue data shows US spot Bitcoin exchange-traded funds (ETFs) took in a net $7.9 million on Nov. 16, ending a seven-session outflow streak that drained $1.91 billion from Nov. 5 to 13.
BTC fell 15.1% over those sessions, from $80,504 on Nov. 4 to $68,314 on Nov. 13. IBIT’s $76.5-million inflow carried the total, while seven other funds posted outflows led by GBTC at $34.6 million.
Bitcoin ETF flows: One inflow is not a reversal
The $7.9-million inflow equals 0.4% of the streak, and IBIT, which recorded no inflow over the 11 sessions from Oct. 30 to Nov. 13, lost $2.35 billion of the $2.99-billion total.
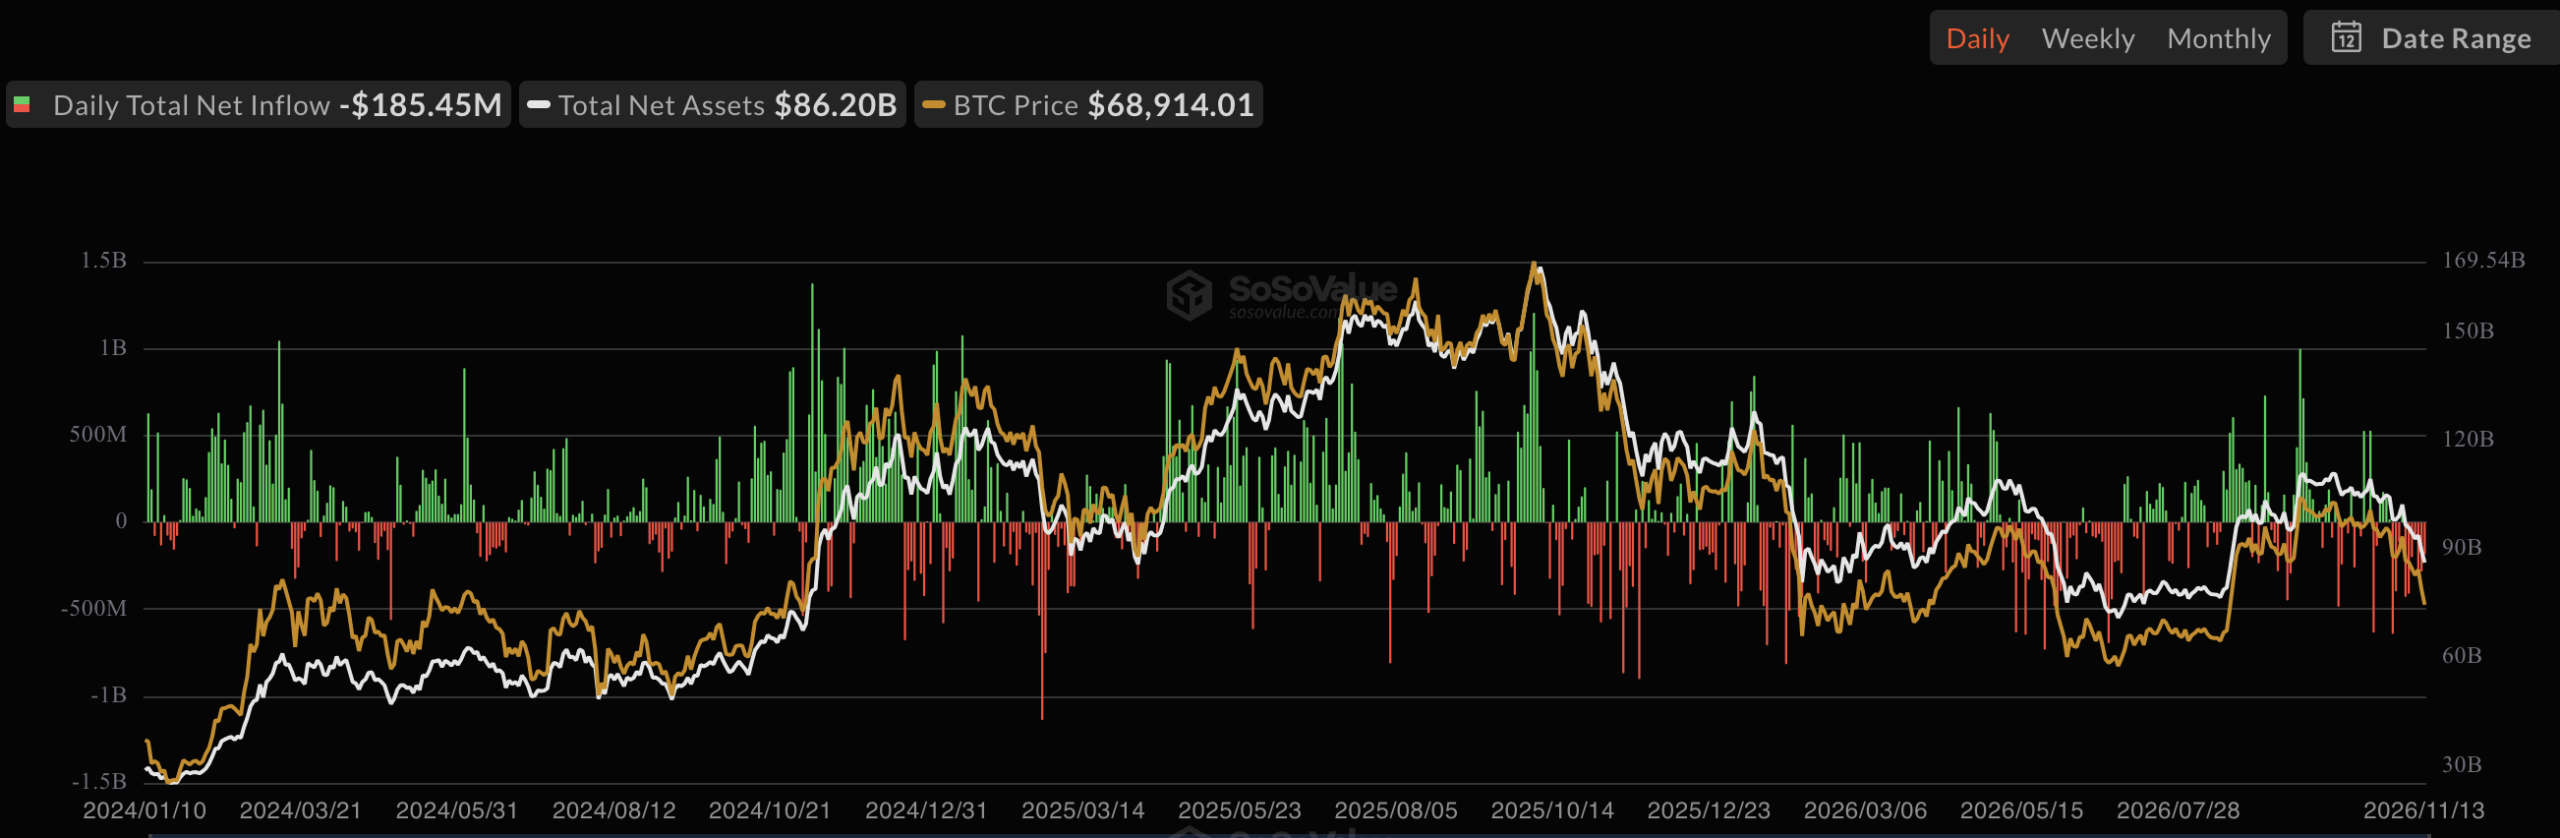
Those IBIT outflows ran through a $1.28-billion ETF outflow week that ended Nov. 6.
2026 net flows swung from plus $3.2 billion on May 6 to negative $1.89 billion on Nov. 16.
Bitcoin price analysis: $63,905 support, $65,696 resistance
TradingView lists the daily candle at an open of $64,835, a high of $65,123, a low of $64,087, and a last price of $64,182 as of 10:34 UTC.
The price sits under the 10-day exponential moving average (EMA) at $68,678, the 200-day SMA at $72,795, and the 200-day EMA at $75,806, the level behind the Nov. 4 wick under the 200-day EMA. Thirteen of 15 moving averages signal downward, and only the Hull moving average at $62,394 signals upward.
The relative strength index (RSI) at 23 is oversold, but the moving average convergence/divergence (MACD) level of -4,015 signals downward, and the average directional index (ADX) at 36 shows a firm trend.
Support is the week’s Binance low of $63,905, then the $62,006 low of Nov. 15; a daily close under $62,006 would signal a downside move. Resistance is the week’s high of $65,696, then the 200-week SMA at $68,191, which Binance’s weekly candles put 6.2% above the price. A weekly close above it would be an upward signal.
Bitcoin funding rate and open interest show a long crowd without conviction
Binance open interest stands at 93,629 BTC at 10:00 UTC, 8.3% below the 102,149 BTC peak of Nov. 12 and in line with the 93,994 BTC open interest and 200-week SMA analysis of Nov. 16, so the reset after the long liquidations at the 200-week SMA has stalled.
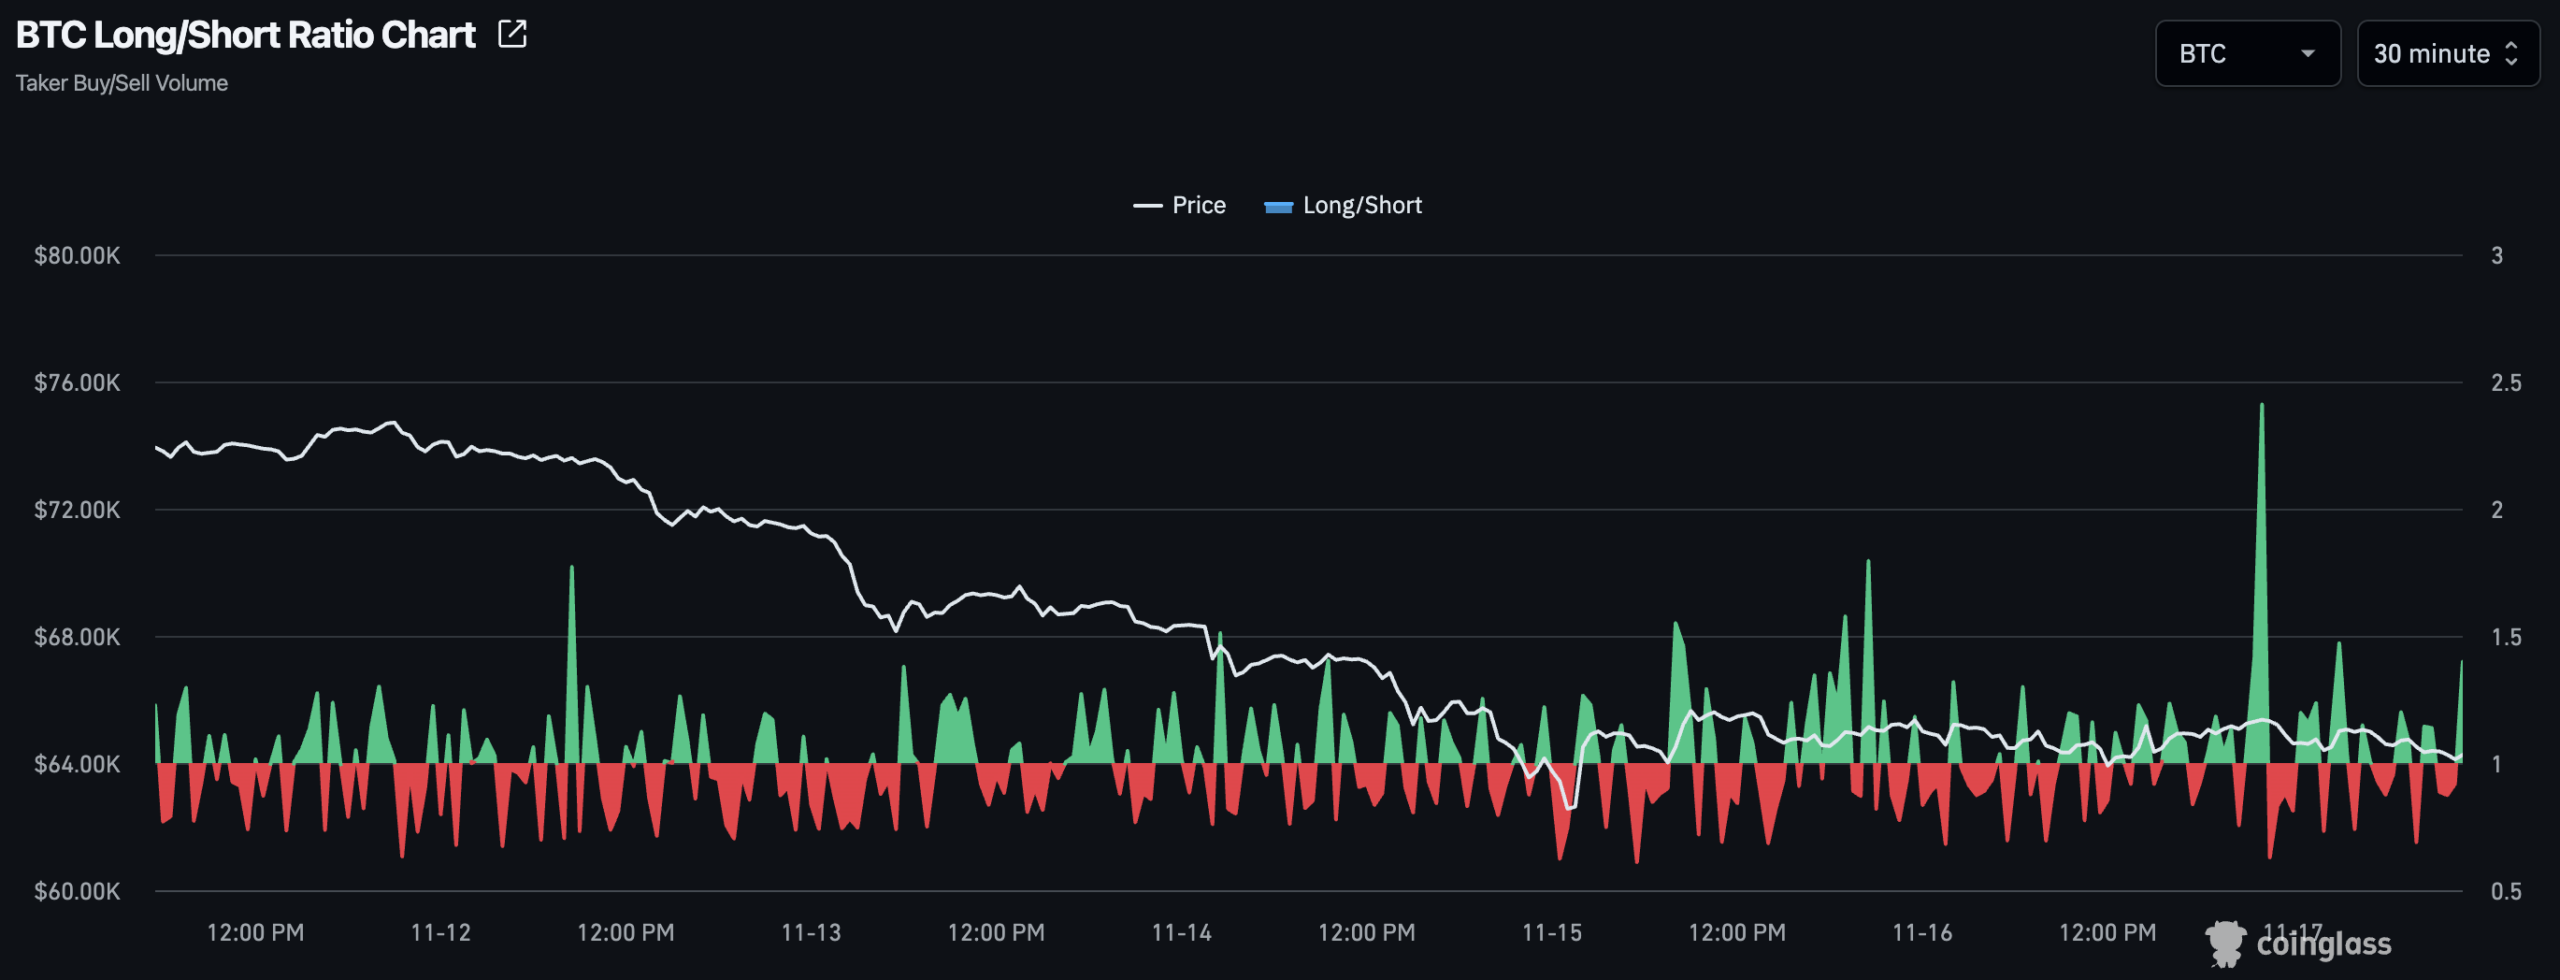
Funding printed -0.0006% at 00:00 UTC and -0.0001% at 08:00 UTC on Nov. 17, yet 74.5% of Binance accounts are long. Near-zero funding means perpetual traders are not paying a premium to hold longs.
Bitcoin options: $73,000 calls dominate the Nov. 20 expiry
Deribit’s Nov. 20 expiry holds 33,286 BTC of open interest ($2.1 billion at the $64,147 index at 10:53 UTC), and 17,128 BTC of calls, or 51.5%, sit at strikes of $73,000 or higher, 13.8% above the index.
If the index stays near $64,000, 20,155 of the 20,195 BTC of calls expire out of the money, although Deribit does not show which side holds each contract.
Bitcoin’s price after past ETF outflow streaks
Farside’s table holds seven earlier streaks of at least seven straight outflow sessions since January 2024. Binance’s daily closes put BTC higher seven days after the first net-inflow session five times, with a median gain of 2.9%, and the misses were negative 3.3% after May 3, 2024, and negative 0.4% after June 4, 2026.
The ETF outflows and exchange inflows of Nov. 12 sit inside the current streak, and seven cases are too few to show an edge.
IBIT’s last back-to-back inflow sessions came on Oct. 28 and 29, so a second inflow when Farside posts the Nov. 17 row after the 4 pm ET close would be its first pair since then.
Disclaimer: This article is for informational purposes only and does not constitute financial or investment advice. Cryptocurrency prices are highly volatile. Always conduct your own research before making investment decisions.