preferred on


Key Takeaways
- Bitcoin trades at $69,279 after a $67,568 low on Nov. 13.
- Longs lost $872.5 million, while Binance open interest stayed near its high.
- The 200-week SMA at $68,002 is the line before $64,725.
Bitcoin (BTC) traded at $69,279 on Binance on Nov. 13 at the time of writing, 5.2% below its 200-day simple moving average (SMA) of $73,096.
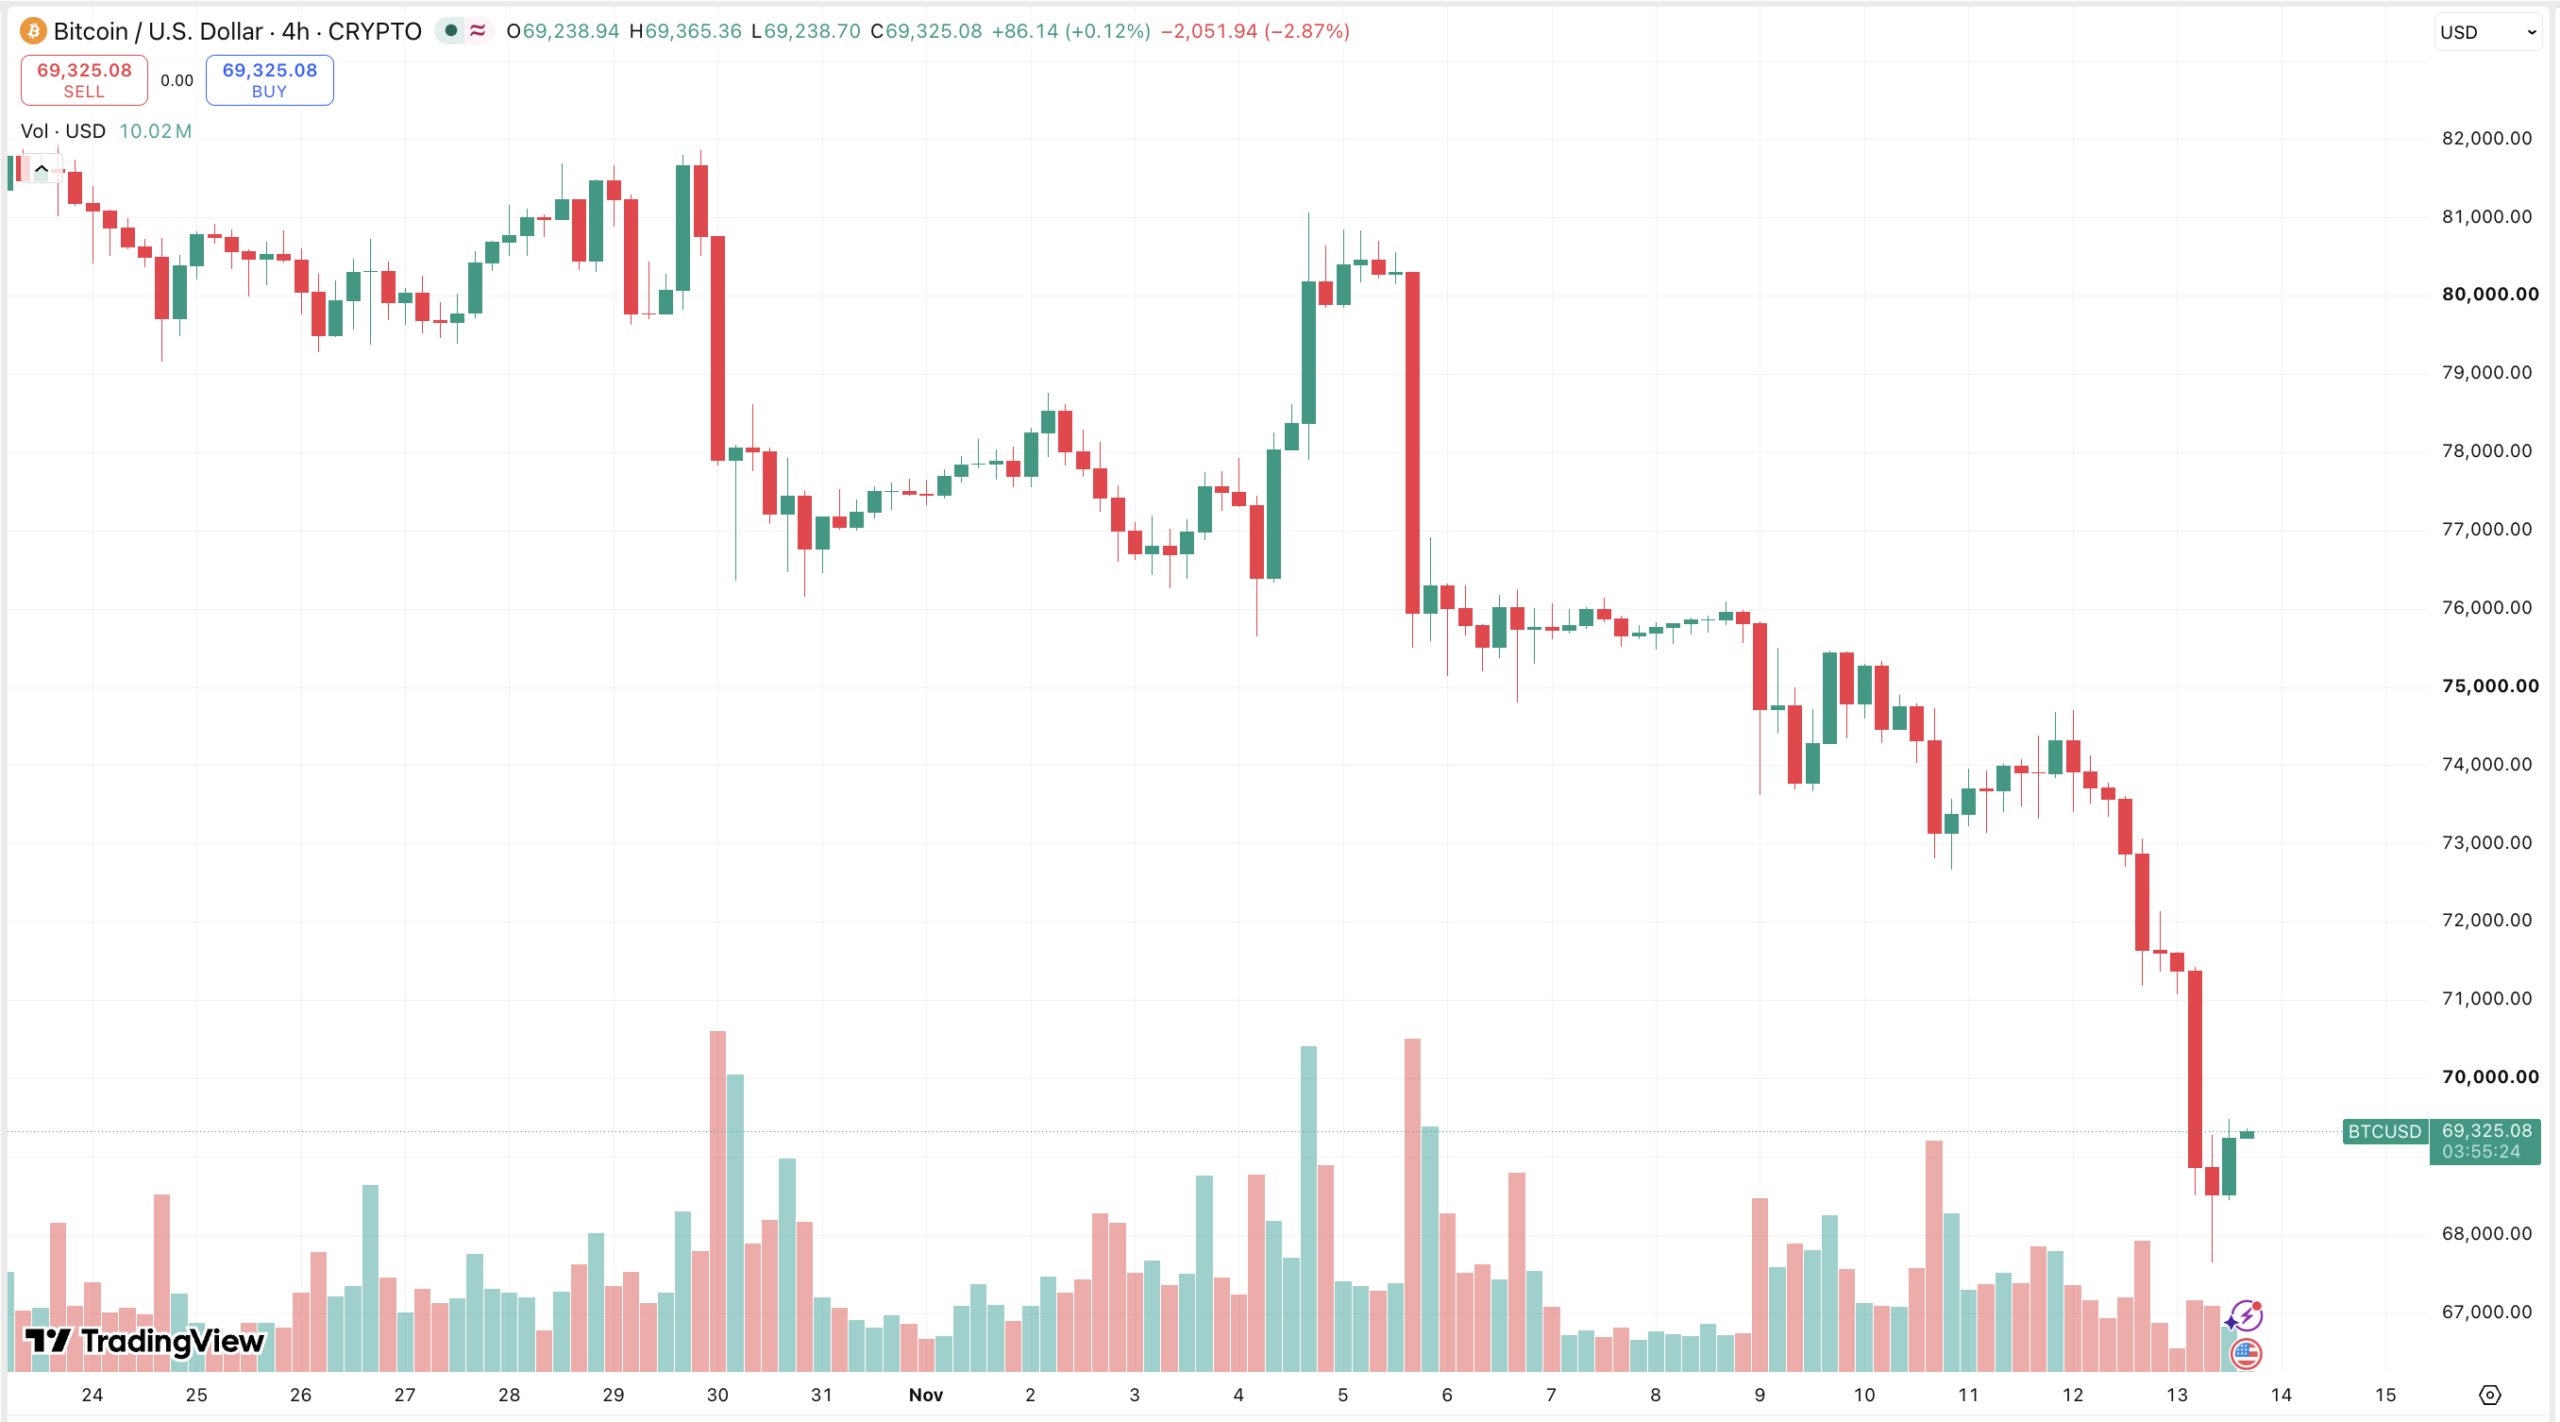
Binance’s daily candle closed at $71,460 on Nov. 12, the first close under that average since Aug. 18, before a low of $67,568 at 05:00 UTC on Nov. 13 broke 0.6% under the 200-week SMA, which averages $68,002.
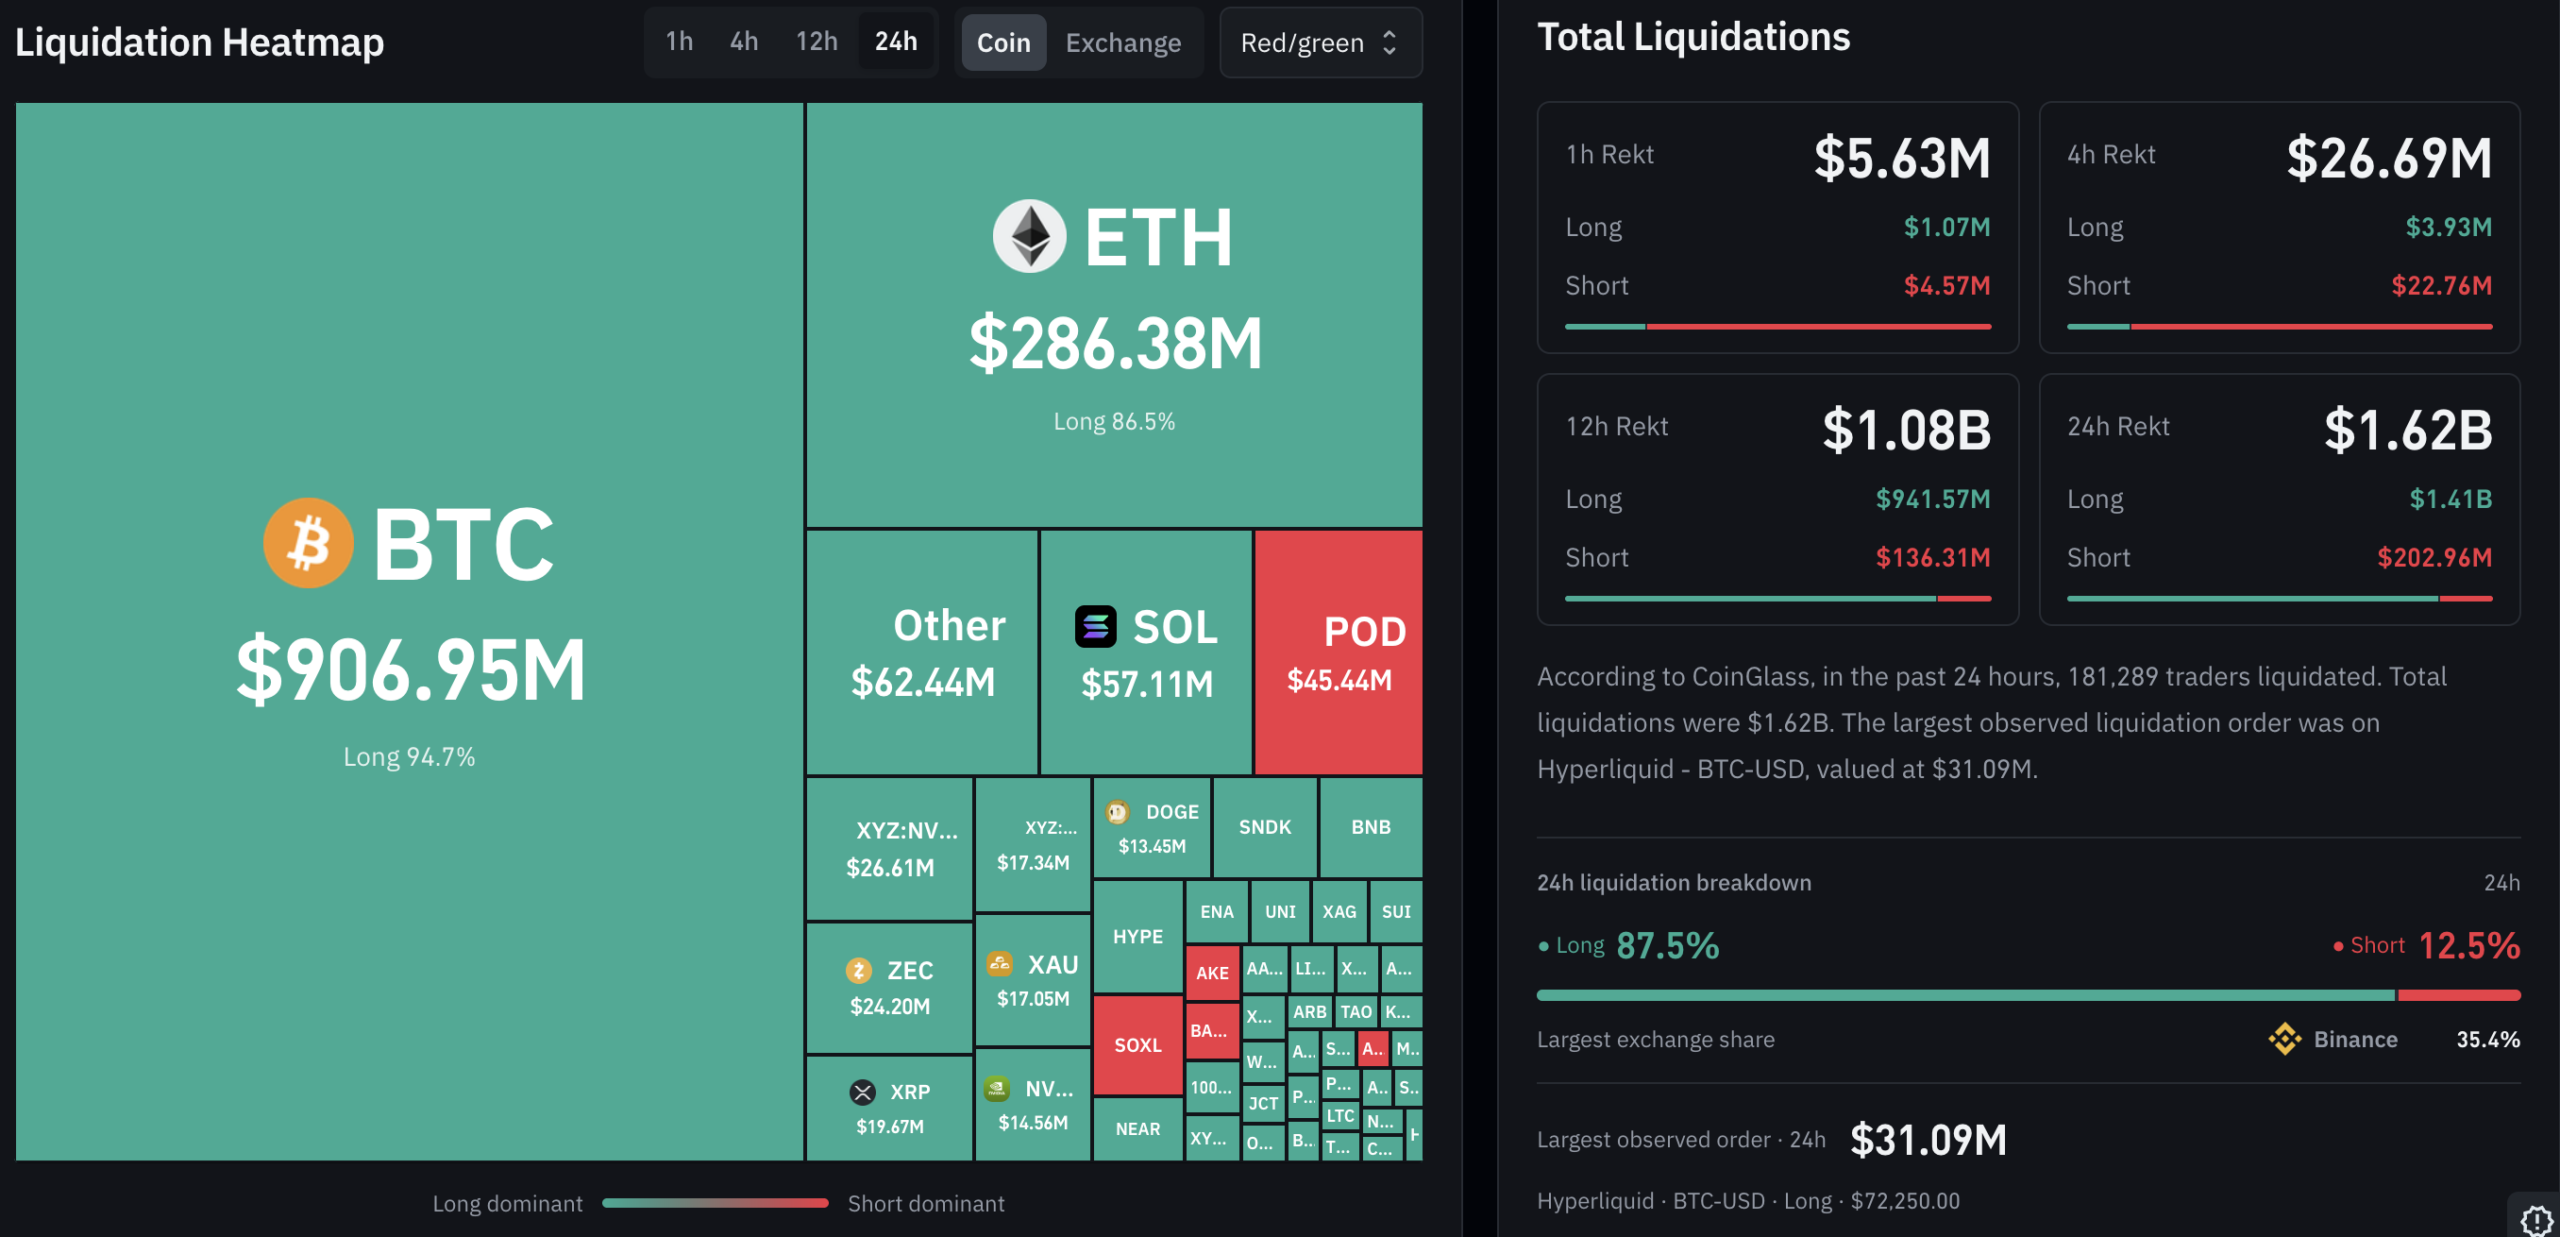
CoinGlass counted $919.5 million of BTC liquidations in 24 hours, $872.5 million of them longs, 4.05 times the seven-day average. Binance open interest still stands at 101,360 BTC, 2.4% above its level at 10:00 UTC on Nov. 12, so traders added leverage while others were forced out.
Bitcoin’s price crash follows 5.10% Treasury yields and Nvidia CEO’s exit
The US Treasury lists the 10-year yield at 5.10% and the 2-year at 4.86% on Nov. 12, up 12 and 13 basis points from Nov. 10. Nvidia filed an 8-K that day reporting that Jensen Huang resigned as CEO effective immediately, with chief financial officer Colette Kress serving as interim CEO.
BTC began sliding at about 11:00 UTC on Nov. 12, and the filing gives no time of day, so the order of events is unconfirmed. Bitcoin already fell 5.5% with the Nasdaq on Nov. 5, so a rate and equity shock in one session plausibly explains the first leg lower.
Bitcoin liquidations hit $872 million as open interest holds near highs
Binance ($312.9 million) and Hyperliquid ($307.0 million) account for 67% of the total, so the flush ran across a centralized exchange and an onchain derivatives venue. It is 4.6 times the $200.6 million of liquidations counted in the 24 hours to 09:48 UTC on Nov. 11.
Binance open interest rose from 99,023 BTC to a peak of 102,149 BTC at 16:00 UTC on Nov. 12, and 77.5% of accounts are long, up from 74.1%. Funding came in at 0.0013% at 08:00 UTC, down from 0.0100% eight hours earlier, so new shorts replaced the longs forced out. Leverage also built into the Nov. 3 dip, when Binance open interest climbed 4.7%.
Bitcoin price analysis: $68,002 support and $73,096 resistance
TradingView records the daily candle at an open of $71,381, a high of $71,417, a low of $67,500, and a close of $69,115 as of 10:07 UTC.
Price sits under the 10-day exponential moving average (EMA) at $73,880, the 200-day SMA at $73,040, the 20-day EMA at $76,031, the 200-day EMA at $76,272, the level behind the Nov. 4 wick, and the 50-day SMA at $80,557, and 14 of 15 moving averages carry downward signals.
The relative strength index (RSI) of 26 marks an oversold reading, yet the moving average convergence/divergence (MACD) level of negative 2,458 gives a downward signal, and the average directional index (ADX) of 25 is neutral.
Deribit’s Nov. 13 expiry settled at $68,709.64 at 08:00 UTC, so the Nov. 9 analysis counted 66.6% of Nov. 13 call open interest at $81,000 and $84,000 that expired worthless. A weekly close under the $68,002 200-week SMA points to Binance’s Aug. 18 close of $64,725, while a daily close above $73,096 would turn the 10-day EMA into the next test.
The Binance weekly candle closes at 00:00 UTC on Nov. 16, about 45 hours before Nvidia reports fiscal third-quarter results at about 21:20 UTC on Nov. 17.
Disclaimer: This article is for informational purposes only and does not constitute financial or investment advice. Cryptocurrency prices are highly volatile. Always conduct your own research before making investment decisions.